
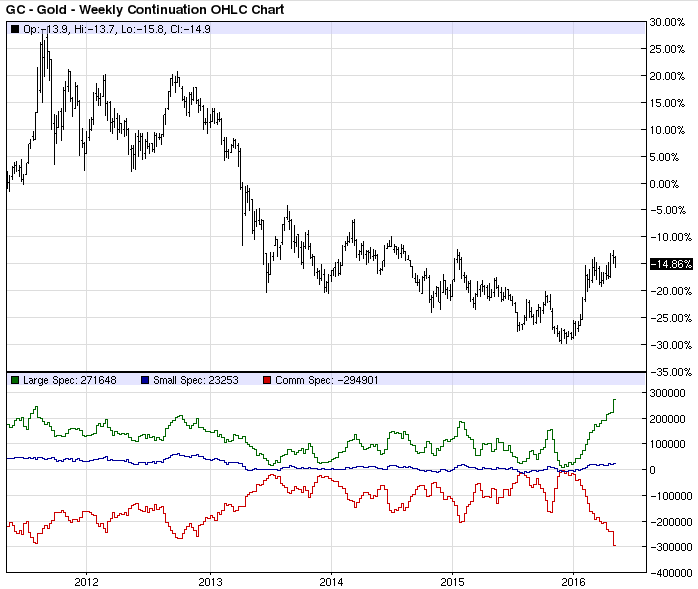
Momentum in gold cooled down after prices touched a 15-month high above $1300 last week. The large net long positioning on the CoT report shows traders are susceptible to a near-term correction in gold.
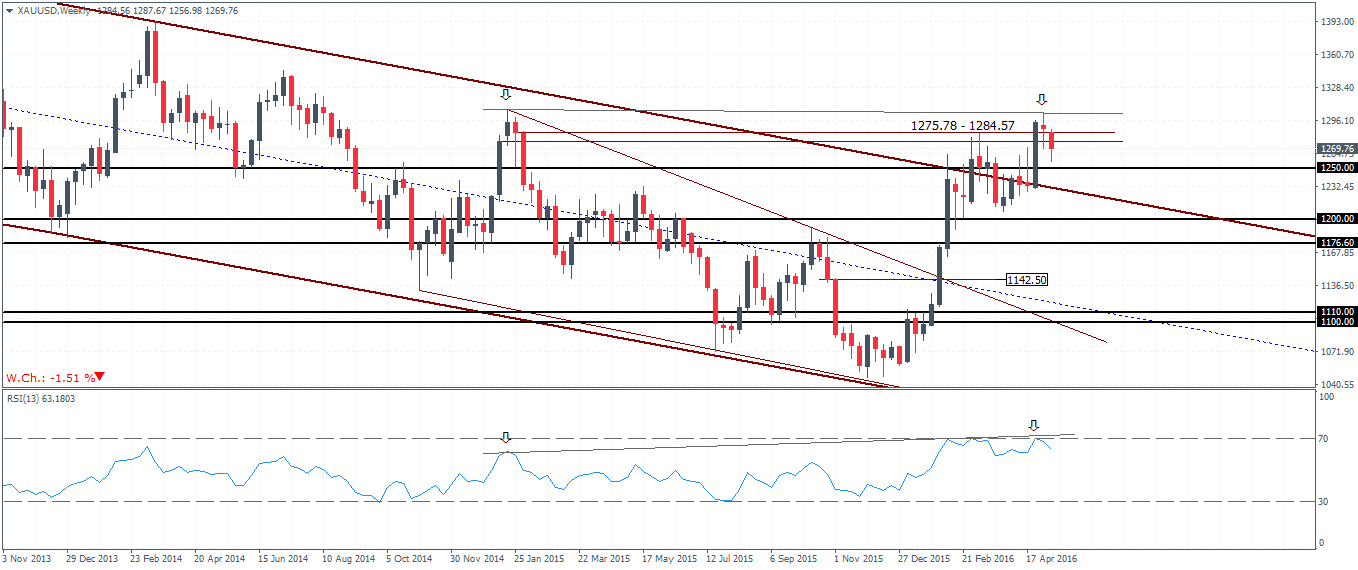
Gold prices are moving into the second week of declines with prices this week posting a low of 1256.98, following last week’s impressive run up to the $1300 handle. With the weekly candlestick closing in a doji pattern near the 1275 – 1284 level of resistance and failing to close above this level the precious metal could likely see a near-term correction in prices, which should provide some good buying opportunity for the long-term investor.
Last Friday’s weekly CFTC CoT positioning data revealed some interesting insights. The week over week change in gold saw the largest increase to $7.5 billion, not seen since August of 2005. This shows the extreme long positions in gold indicative of a near-term pullback. At the same time, the US dollar continues to remain net short, widening to $6.7 billion.

Seasonally, May is a soft month for gold and at the same time is considered to be a strong month for the US dollar, which along with the technical levels on the chart could see some strong moves over the coming weeks. The question, however, remains whether gold can correct to the elusive $1200 handle on this correction.
Gold – Technical Outlook
The weekly chart shows price action currently turning bearish after a brief slip to this week’s low near 1256.98. The pullback could see gold currently near the 1269 levels, move as high as 1270 – 1280 region, but anything above this level could be seen as a retracement. Price action is strong near this resistance level of 1275 – 1284 and with the hidden divergence in play on the weekly chart, we expect a decline in the support seen at 1200 – 1176 levels.
On the daily chart, price action formed a spinning bottom yesterday, 10 May 2016 coming near the lower median line. A move to the upside could possibly see gold posting a lower high near the minor resistance of 1279.80 – 1280. Such a move would confirm the upside being capped as gold could slip towards 1233 and eventually 1216 – 1200. The main support at 1216 – 1200 needs to be broken to confirm any downside bias in gold, which will see a sharp dip towards 1108 which could post a strong correction and one that, is well overdue.
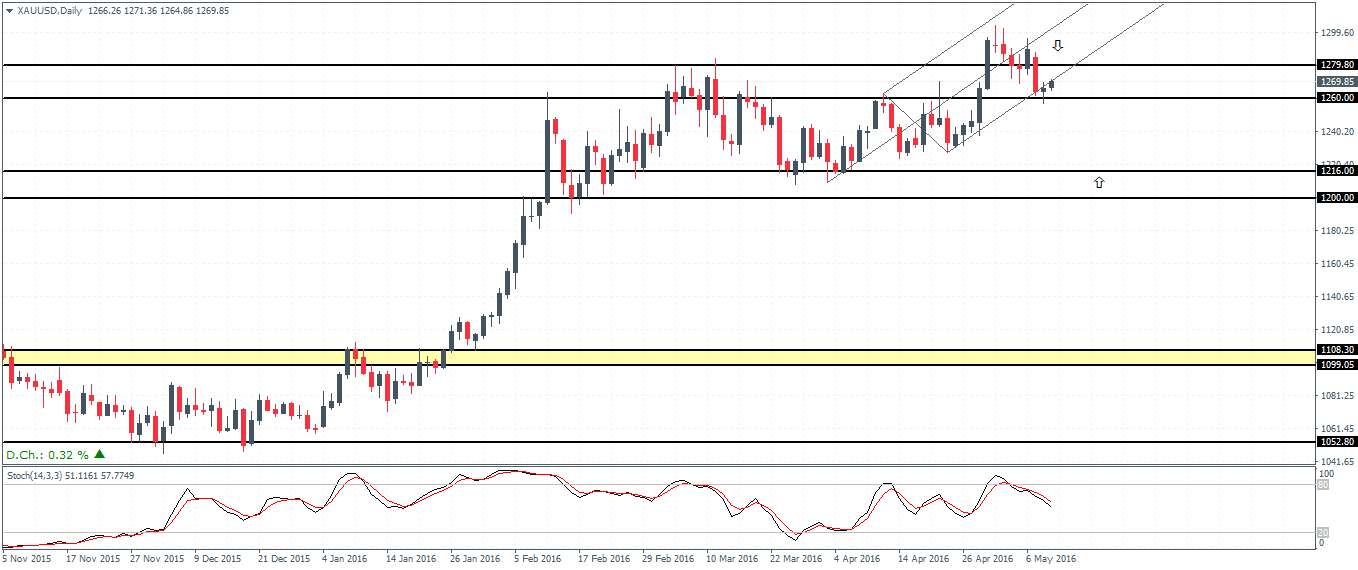
Gold’s long-term trend remains biased to the upside and looks more and more bullish after prices snapped out of the sub-1100’s in December – January. If prices are well supported above or at the $1200 levels, gold prices could just be warming up for another leg in the rally which this time could easily break above the $1300 handle. However, the trick remains in catching gold at an ideal price level as we have a strong support zone near 1176 – 1200, which is about $24 difference.

