
WTI Crude oil is showing signs of a retracement to the strong rally which has sent oil prices to a 5-month high. The question is whether this will be a retracement or the start of a new leg in declines.
Summary:
- Oil prices rallied over 68% after posting lows of $26 in February this year, last seen around 2003 – 2004
- The daily doji candlestick pattern formed three days ago comes after an 11-week rally
- Oil production continues to stay elevated, which could see the current dip in oil moving back to reflect the underlying fundamentals
Oil prices are down 3.0% this week after prices posted a 5-month high in April at $46.77. The strong rally that was fueled by speculation of production freezes ignored the fundamentals as US crude oil inventories continued to show a steady build up. Following the doji candlestick pattern on 29th April, oil prices are into their third day of declines, in what could be the start of a correction to the rally, which saw oil prices lift off from a multi-year low near $26.05 in early February this year.

Yesterday, the US weekly crude oil inventory report showed a larger than expected build-up in stockpiles, rising 2.8 million barrels, compared to expectations of a 1.7 million build up. The weekly inventory buildup comes after a 2 million build the week before. The EIA report comes following the API crude inventories report which showed 1.3 million barrel build up. On the production front, oil production shows no signs of letting go with Iran keeping up its pace of production, which in turn is pushing other oil producing nations to keep up their production levels at record highs.
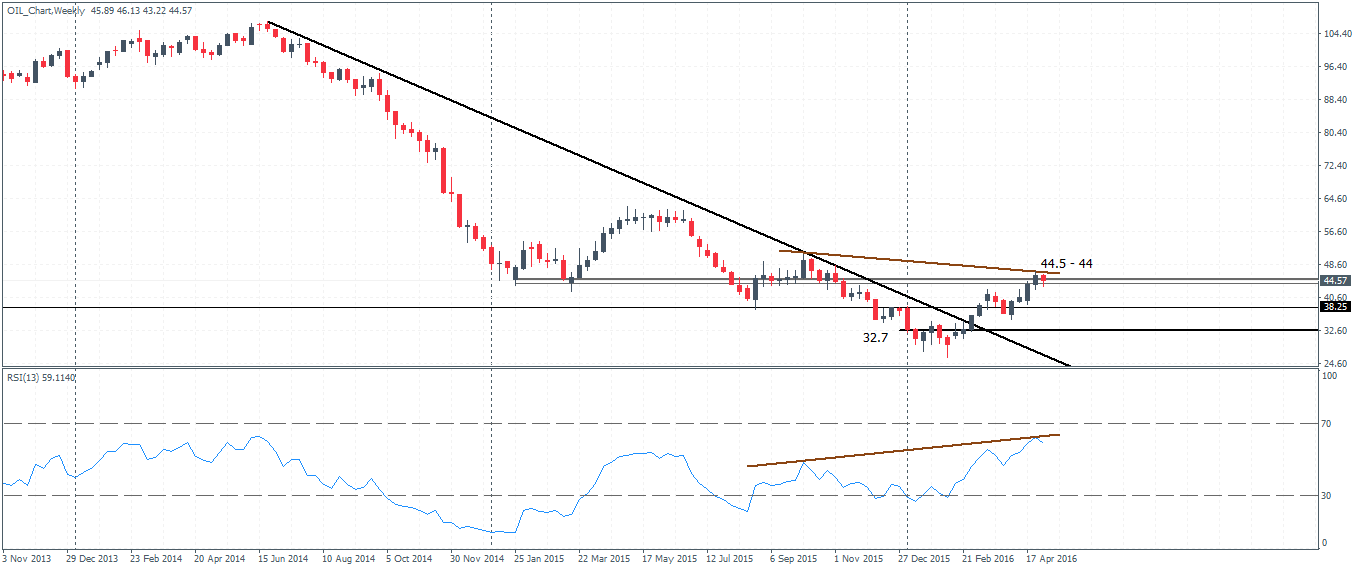
Crude Oil Technical Outlook
On the weekly chart, the hidden bearish divergence we see remains in place, after the RSI shows a new higher high against the recent lower highs in oil, compared to $50.92 highs formed in the week of 4th September. Support is seen near the $38.25 level which could be tested if the current declines continue.
On the daily chart, the bullish rally ended with the doji near the top followed by declines over the past three sessions. The support/resistance level near $44.50 – $44 has been broken, but a firmer retest to this level could establish the downside view in Oil. Support comes in at $42.48, which makes for an ideal level for oil prices to post a modest bounce to establish resistance near the broken support of $44.50 – $44.0.
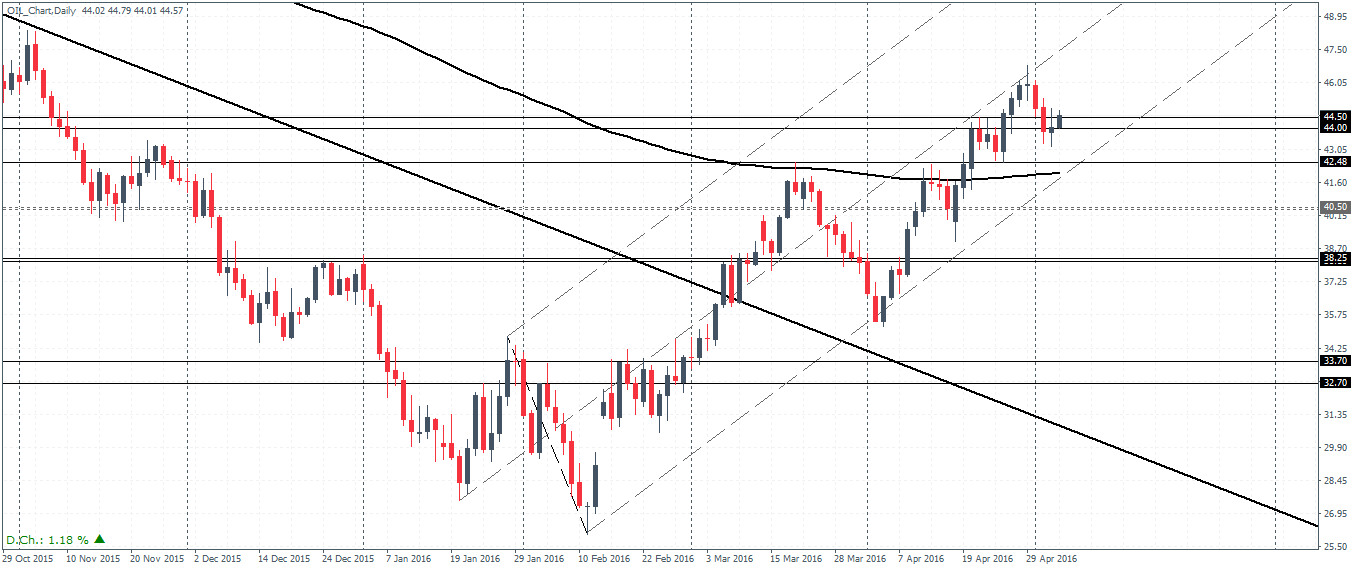
We expect to see further declines, but short term bounces are likely near 40.50 followed by 38.25 – 38 levels. Further below, support at 33.70 – 32.70 remains as a most likely level for oil prices to decline depending on the momentum of the bearish trend.
Overall, we expect to see oil prices start to look weaker over the next few weeks, which could be validated based on the weekly oil chart closing on a bearish note. Establishing resistance near 44.50 – 44.0 would no doubt seal the deal for a retracement. However, it is too early to tell if the current declines will mark the potential for new low in oil prices. Therefore, keep an eye out on the lower support levels near 38.25 – 38.0.

