
The thing about chart patterns is that they are very subjective. Most of the times, the eye sees what it wants to see. And it is the same with chart patterns as well. What might seem like a head and shoulders pattern to one trader could well be seen in a different light by another trader. However, ignoring the chart patterns and sticking to one’s bias could turn out to be an expensive affair.
Gold prices have set the $1200+ levels as the new norm this year. Since the first quarter rally, gold hasn’t made any meaningful pullbacks to the rally, leaving most traders doubtful on where to enter into the strong trend. While prices have been capped near yearly highs of $1283.65, it is quite clear that $1250 has been the magic number. Every time gold prices fell, the $1200 support has proved to be elusive, and gold prices continue to simply reverse and head back to the $1250 handle. This week, we saw yet another glimpse of this scenario playing out.
While gold bears might be staying on the sidelines, there are increasing signs of further upside in the yellow metal. This view is fundamentally supported by the current economic environment. Interest rates are low everywhere with central banks continuing to talk about negative interest rates. The ray of hope from the US Federal Reserve is also starting to fade with April definitely out of the question and expectations for June fast fading. In fact according to the Fed funds futures markets, only one ‘modest’ rate hike is expected this year. While Fed officials go back and forth making things more uncertain, gold has managed to take advantage of the situation rising steadily and showing no signs of letting go.
The chart below and the pattern we are talking about is the bullish pennant pattern that is currently taking shape on the daily chart in Gold. With the 50 period daily EMA sitting comfortably above the 200 period daily EMA, signaling a bullish market, a validation of this bullish pennant, which signifies a continuation of the up-trend, could see Gold prices aim for new highs.

A bullish pennant pattern usually follows after a strong trend is established as prices pause momentarily (in relation to the time frame) before resuming the previous trend.
The measure moved approach, which is taken from the high and the low of the previous uptrend, also known as the flag post, connecting the lows from 17th December 2015 at 1047.78 and the highs of 1283.65 from 11th March 2016 gives a minimum target to 1429.42.
Even if gold posts a pullback, the bullish bias is likely to stay intact unless we see a strong breach of 1193.55 level, which marks the 38.25% retracement of the March 216 highs and December 2015 lows.
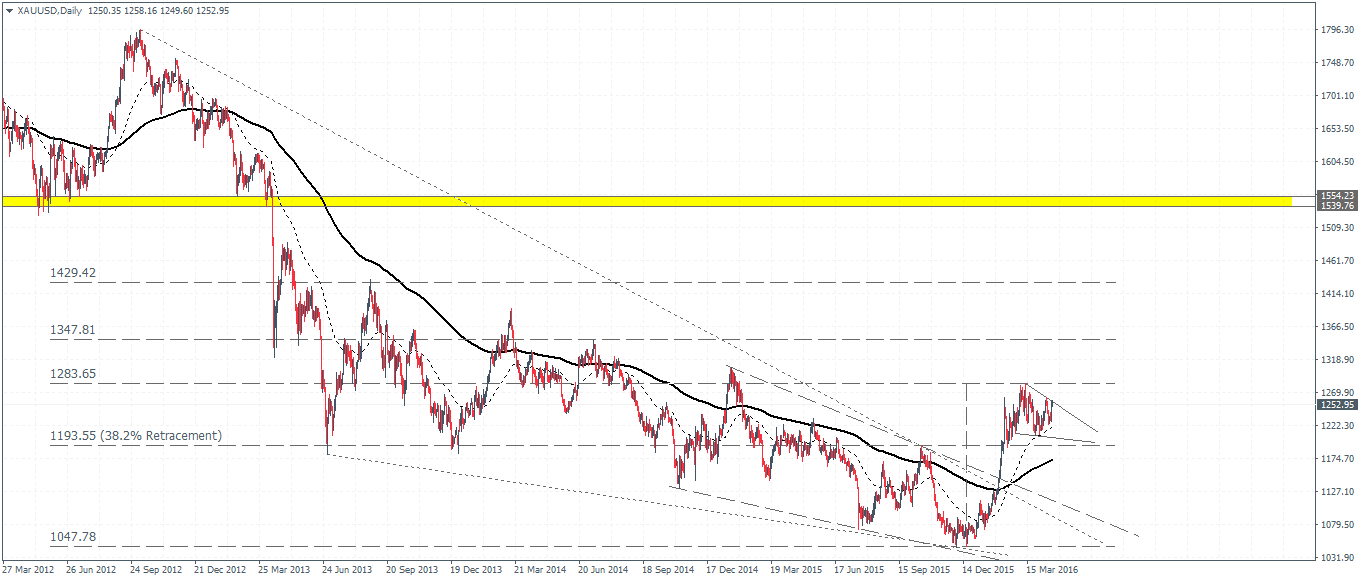
Note the early-mid December 2015 breakout from the longer term descending wedge pattern which started off the bullish run, followed by the current consolidation.
For gold prices to push higher, the monthly chart also shows an interesting setup. Gold prices were flat in March this year and in the process closed with a doji candlestick pattern. The range established from gold’s March price action is 1283.65 high and 1208.38 low. A monthly close above this doji high could signal a continuation of the trend while a monthly close below 1208.38 could start making the bullish bias questionable.
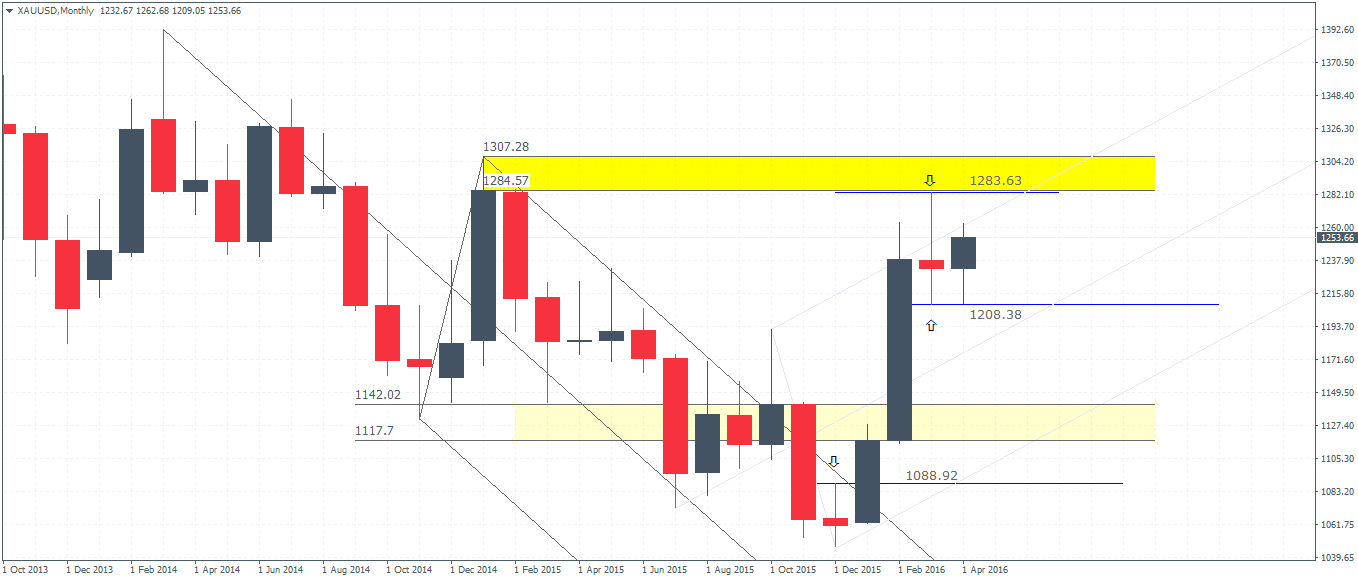
Gold (1252) – Monthly Chart, doji
For the moment, price action is clearly in favor of further upside in gold. For those who missed this rally, watch for potential pullbacks to the $1200 – $1193.55 region which if holds could see gold prices resume their uptrend.
The first level of interest and essential for opening further upside in gold is, of course, a break above the previously established highs at 1283.65. A convincing close above this high will bring 1347.81 as the initial level. However, that’s for later.
For the moment, patience is of the essence. Wait for gold to pullback to $1200, gauge the fundamentals when gold hits this key level for what could either be a monster move or perhaps a damp squib.
One of the global firms that is bullish on gold is The State Street Global Advisors’ $33 billion SPDR Gold Trust (GLD) ETF, which is up 15% on a year to date basis.
George Milling-Stanley, head of the firm thinks that the first quarter move in gold was not hot money and makes a key statement in an interview with CNBC recently.
“We think most people were dangerously underweight gold or out of the market altogether”
Stanley expects to see gold prices reach $1350 – $1375 by Christmas and notes that there is more risk to the upside than downside. So who will get the Christmas present? Bulls or bears? Time will tell how prices will evolve over the next few quarters.

![Credit Card 160×600 [EN]](https://assets.iorbex.com/blog/wp-content/uploads/2023/06/13144507/Blog-Banner_EN-Banner_160X600X2.webp)