While Gold and Silver prices showed signs of retreating from their yearly highs over the past weeks, it is clear that both the metals are likely to see another leg to the upside going by the market sentiment and the technical patterns on the charts. Yesterday, Gold posted another 1.0% gains as a high risk off sentiment evolved during the day sending Gold back above the 1220 levels. The multiple reversals just a few points above the $1200 level which hasn’t seen a test in nearly five weeks can be frustrating to most traders. The recent turnaround in the metals could see another move higher, although we expect that there won’t be any new highs being made in the near term unless prices move lower to establish resistance.
The performance in the precious metals has been quite impressive leading to many bulls in the precious metal making bold calls expecting to see further upside. For example, Gold is touted to see $1300 and higher this year, a stark contrast from the fourth quarter of 2015 where Gold was being forecasted to test the lows of $1000.
On a week to date basis, Gold prices are up a modest 0.55% while Silver is up 0.07%. Today’s FOMC meeting minutes will be the main risk event. Given the tone of the Fed Chair Janet Yellen and the FOMC’s statement in March, the markets are inclined to expect the meeting to stay dovish. Therefore, the upside risks in the precious metals are likely to be limited while the downside risks increase in case of a surprise. However should the Fed’s minutes today show any signs of hawkishness in the language, Gold could also perform higher given the uncertainty and the flip-flop of the Fed officials.
Gold – Technical Outlook

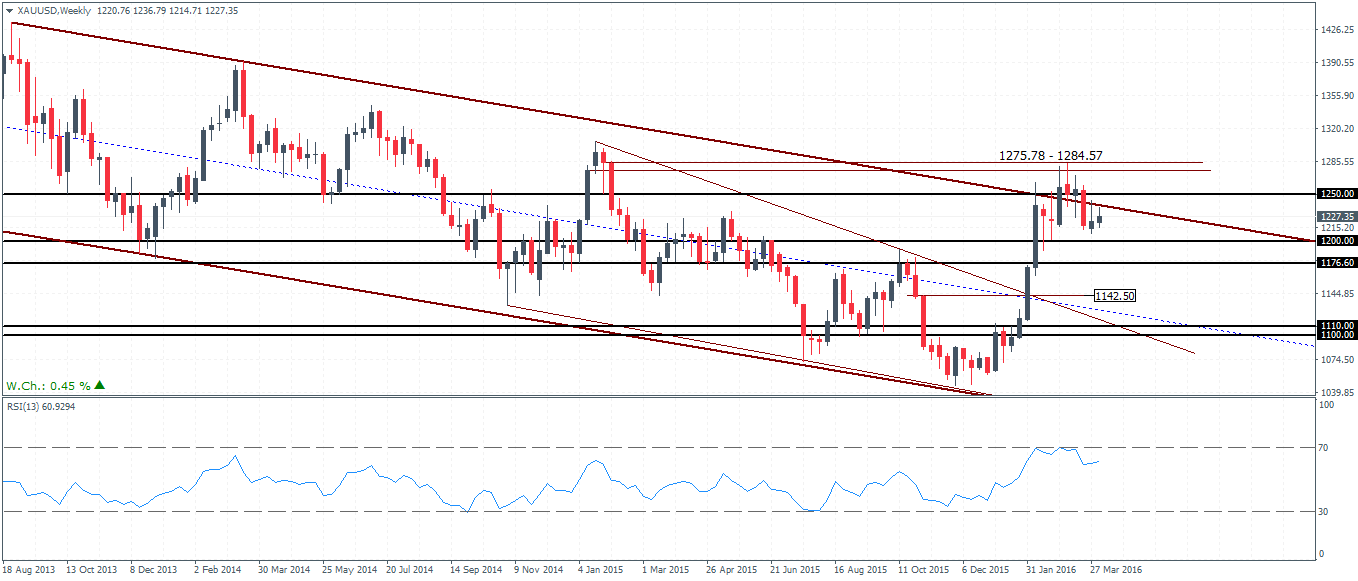
The weekly chart for Gold shows price action staying quite strong above the $1200 handle. The strong bearish candlestick from two weeks ago is likely to see any upside staying limited, but that could change should we see prices close above the $1250 handle on a weekly basis. Despite that, the upside remains limited as the price will struggle near the 1275 – 1284 resistance level that was previously established and strongly rejected with Gold only managing to post a high at this level of resistance. An interesting observation worth noting is the monthly charts where we see that March’s price action has resulted in a doji pattern, indicating a short-term pause to the previous two month’s strong rally.
On the daily chart, we notice that prices are consolidating within a newly formed falling wedge pattern. An upside breakout here could see Gold prices move back to the $1250 – $1267 levels, but beyond that further upside looks unlikely. A retest back to this level could keep the correction to $1200 intact.
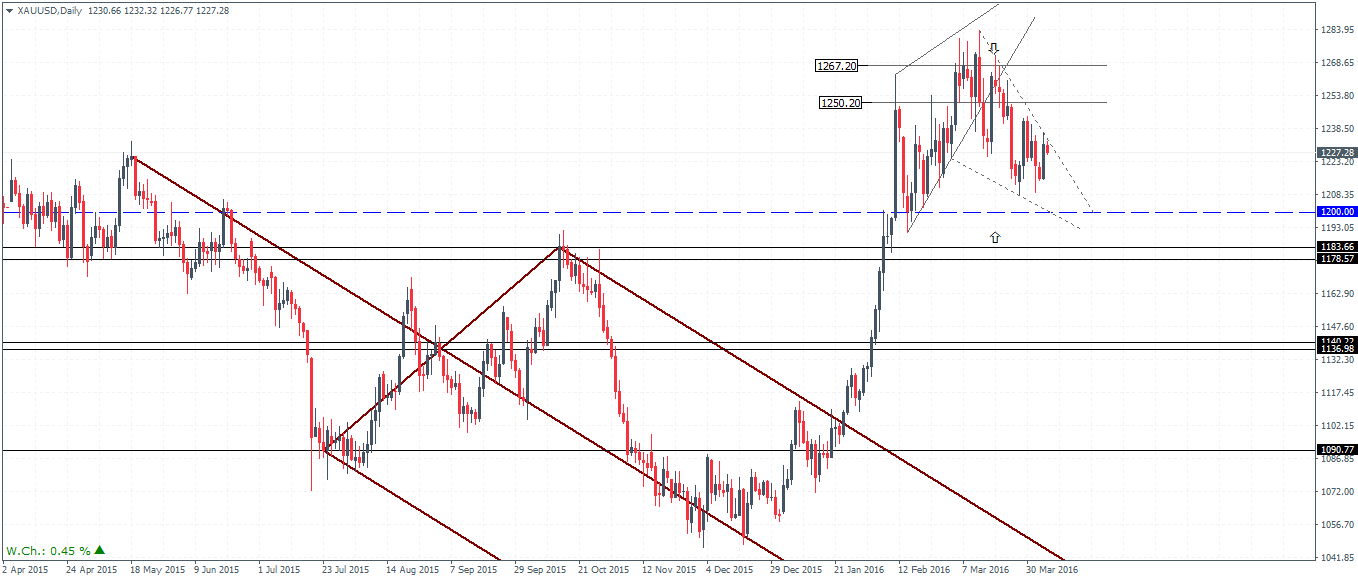
To conclude, Gold prices are poised to move back to the $1250 – $1267 level of previously established resistance on the daily chart. As long as prices are capped here, the upside is limited while a test to $1200 remains very likely.
Silver – Technical Outlook
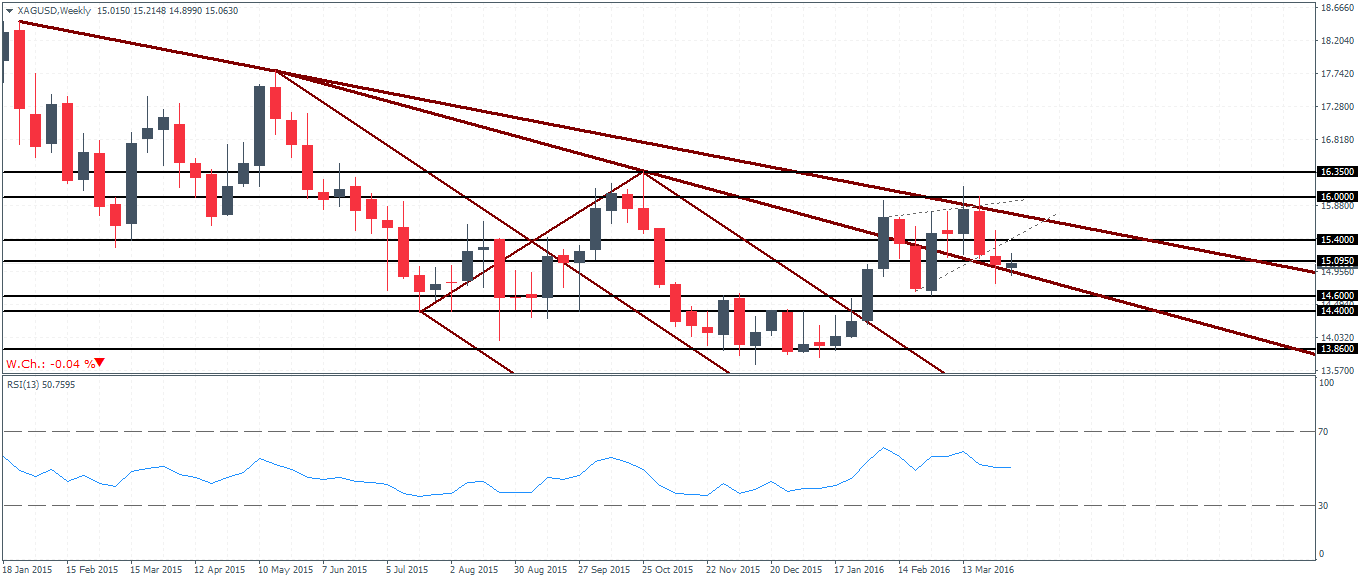
Silver prices have broken out from the minor rising wedge pattern but last week’s price action closed out in a small bodied spinning bottom pattern. A move to the upside this week could see a correction that will likely be limited to the 15.4 region in the short term indicating that the upside is likely to stay limited. The RSI continues to show the hidden bearish divergence which also validates the downside bias.
On the daily chart for Silver price action is now trading within a falling median line following the breakout from the rising triangle pattern. To the downside, Silver could test the lows of $14.72 – $14.60 while to the upside a test to the previous resistance at 15.47 – 15.43 is very likely.
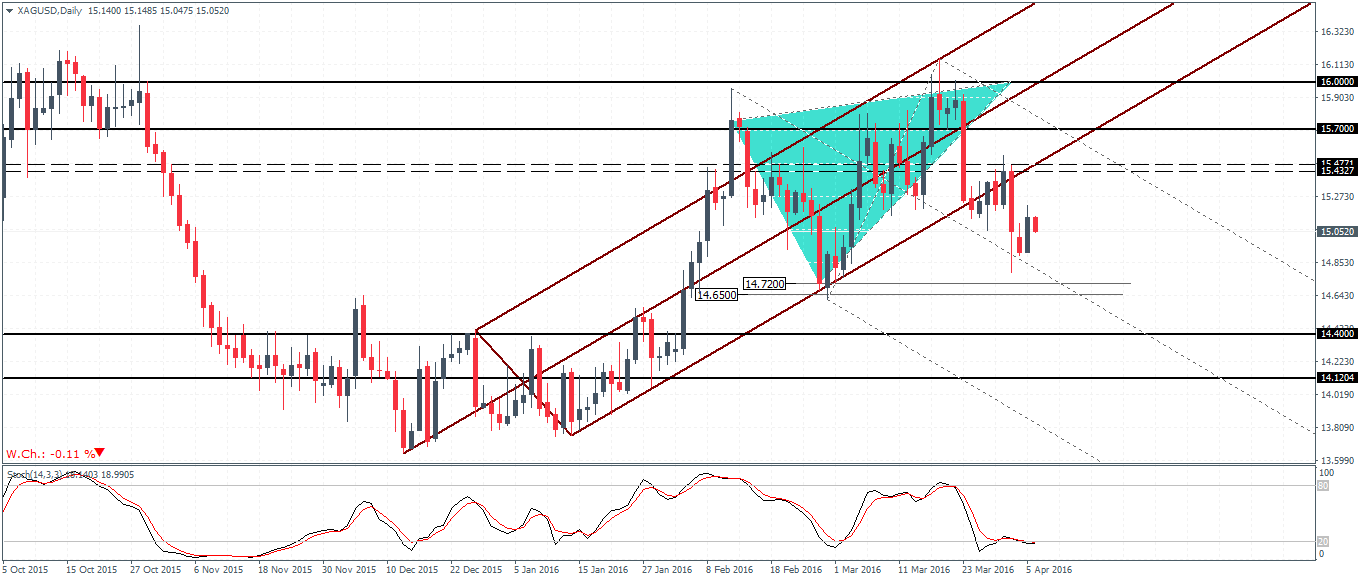
To conclude, Silver prices are likely to move to the downside following a test of resistance at 15.47 – 15.43. The upside remains limited, and a retest here could see Silver fall towards 14.72 – 14.65 which marks the previous support.

