
Dollar Index posts one of the biggest losses in a quarter in Q1, 2016
Summary:
- Fed’s gradual rate hike path keeps the bearish momentum going
- Weaker US Dollar could help the commodity prices, but only so much
- Export and commodity exposed economies may feel the brunt of a weaker US Dollar
- Emerging market currencies likely to see a strong bull run
The US Dollar Index saw one of its worst performances in recent times, losing around 4.12% since January 2016 through March 31st, 2016. Despite starting the year on a broadly bullish note, supported by the US rate hike cycle, the US Dollar Index continued its descent after multiple attempts to break above the psychological level of 100. The following months saw the Federal Reserve turn bearish on US interest rates leading the Dollar broadly weaker. On a weekly basis, the US Dollar Index is down 1.66%, closing yesterday at 94.66

Economic data from the US has been mixed but nothing drastic. However, the big catalyst came from the FOMC’s March meeting where besides leaving interest rates unchanged, the Fed also lowered its rate hike forecasts for the remainder of 2016. More recently, earlier this week, Federal Reserve Chairwoman Janet Yellen expressed concerns on US inflation and preferred to take a cautious approach than hike rates aggressively. Making references to potential easing should the US economy flip over also added to the dovish sentiment.
The decline in the US Dollar is likely to continue over the coming months and could help support the commodities which have been in a rather prolonged bear cycle. But on the flipside, a weaker Greenback will mean most export oriented economies will have to face the flak. Economies such as Japan are already reeling under the effects of a stronger Yen and more recently Canada’s manufacturing started to show signs of weakening due to the CAD’s appreciation against the US Dollar.
US Dollar Technical Outlook
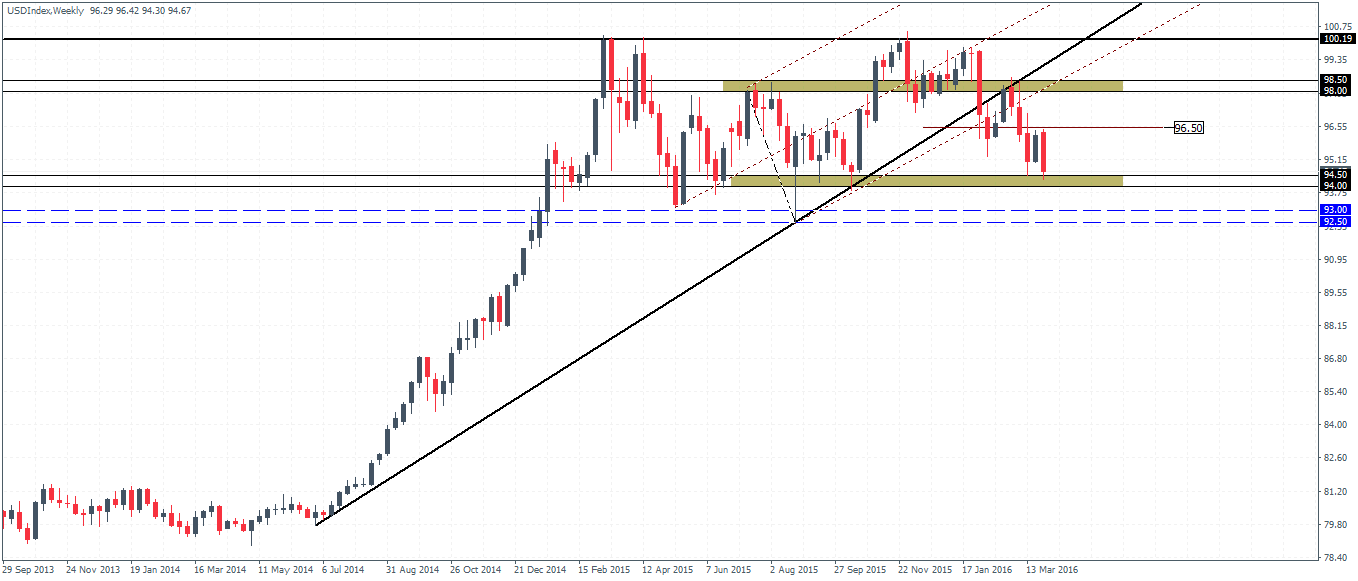
The weekly chart for the US Dollar Index shows a bearish candlestick taking shape so far. This comes after last week’s inside bar that was formed following the breakout from the longer term trend line. Prices are currently in the support zone of 94.50 – 94.0, below which a minor support at 93.0 – 92.50 come in to support the prices. A break below this last line of defense could see the US Dollar continue to push lower and rather strongly.
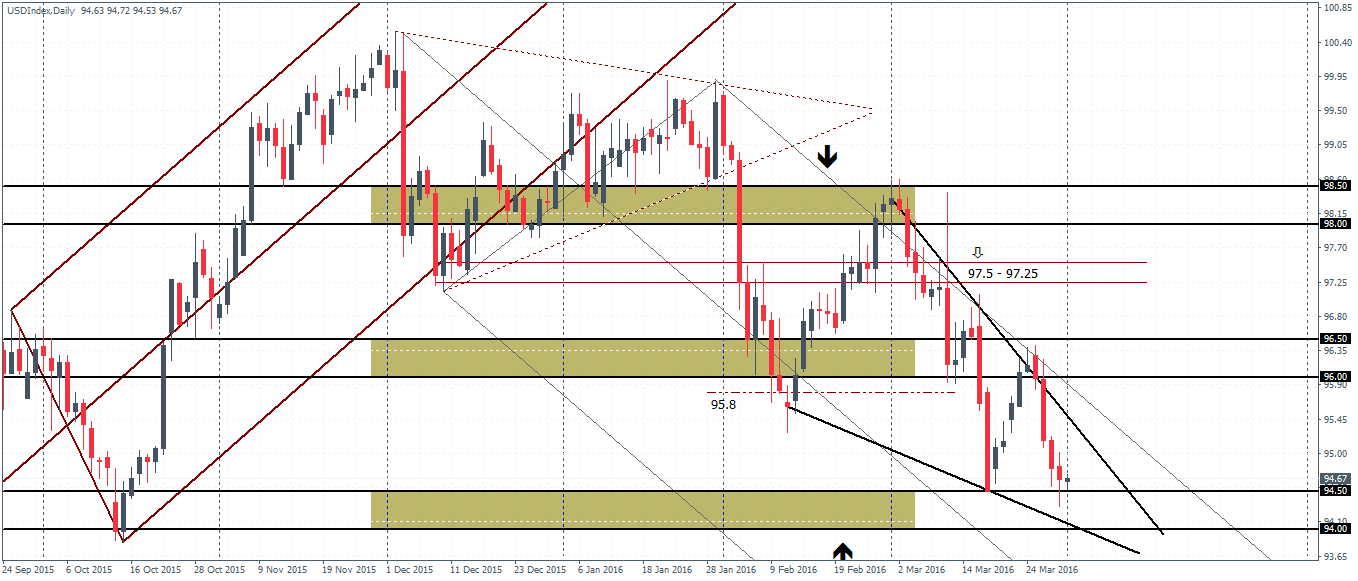
On the daily chart, the US Dollar Index is currently moving within a falling wedge pattern. While it is hard to expect if the trend line connecting the lows of 11th February and 17th March will hold, a possible bounce off this trend line which also shows confluence with the support level could see the Dollar Index recover to the upside towards the 96.0 – 96.50 resistance level.
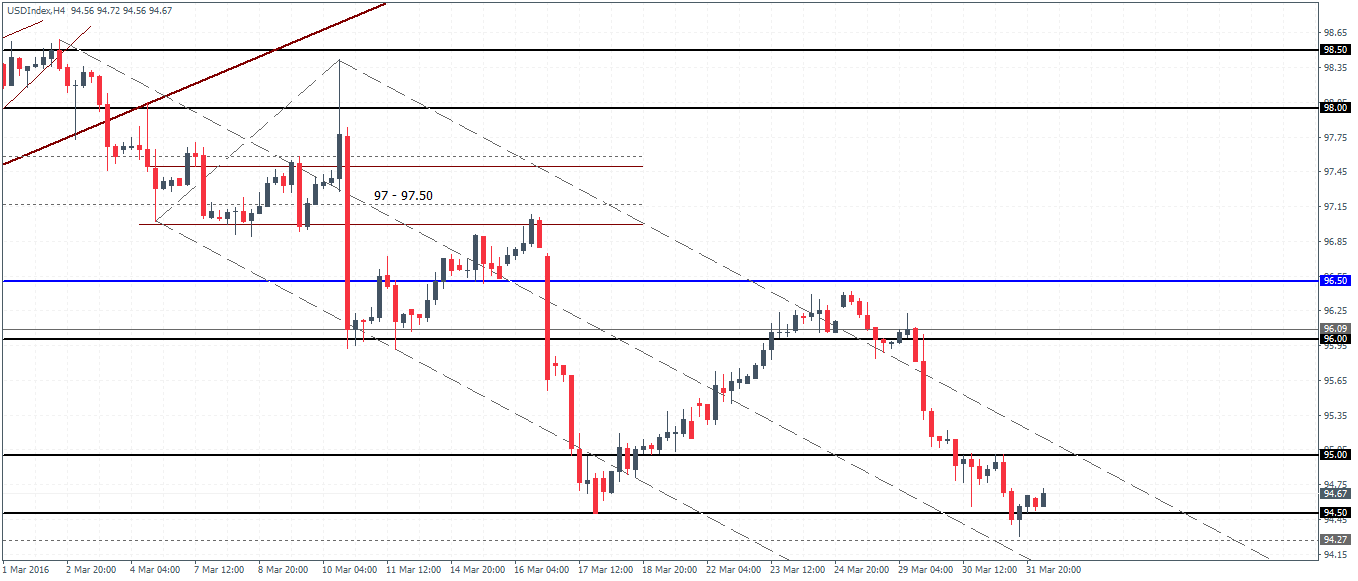
The 4-hour chart is currently trading close to the lower support at 94.50 – 94.0 and does not show any potential signs that a correction is on the horizon. In this aspect, a break below 94.0 could start to see the bearish declines gain momentum. Today’s NFP report might offer a bit of hope if the data manages to surprise to the upside. However the gains are likely to be limited. Alternately, a miss on the estimates in the NFP print could just be the catalyst needed for the bearish momentum to start gathering pace.
In conclusion, the US Dollar Index sits at 94.50 – 94.0 support level as expected. A bounce off this support could see prices recover to 96.0, but a failure below 94.0 support could start the bearish momentum push USD lower.

![Credit Card 160×600 [EN]](https://assets.iorbex.com/blog/wp-content/uploads/2023/06/13144507/Blog-Banner_EN-Banner_160X600X2.webp)