
Image via harry_nl / Flickr
Shrugging off inventory buildup and led by a weaker US Dollar and a broad commodity rally, Crude oil prices are back trading near January 2016 highs with potential for further upside in store
Following up from the previous week’s Crude Oil technical analysis, WTI Crude Oil has posted strong gains this week to trade near the $38 handle. The gains came as the weekly inventory report showed an increase in the US commercial stockpiles rising 3.9 million barrels, more than the expected 3 million barrels. The increase in the stockpiles came as the previous week saw record inventory levels of 10.4 million barrels. However, the gains came as Cushing stockpiles of gasoline and distillate inventories fell below estimates. The report comes after EIA lowered its price forecasts, noting that Brent Crude Oil and WTI would average around $34 in 2016. The recent rally in the commodity prices saw many big names calling the rally ‘unsustainable’
OPEC and non-OPEC members are scheduled to meet on March 20th according to Iraq officials with the main agenda being the output freeze deal alongside discussing other ways to stabilize the Oil markets. Iran remains a strong opponent of the idea as it has reiterated that it would continue to boost production to reach the pre-sanction levels while Kuwait’s oil minister said on Tuesday that the country would freeze production only if all the other major oil producing nations participate in the freeze.

While Oil prices might be enjoying a rally alongside a weaker US Dollar supporting the short-term gains, it is very likely that the March 20th meeting could be a big risk.
Crude Oil Technical Outlook
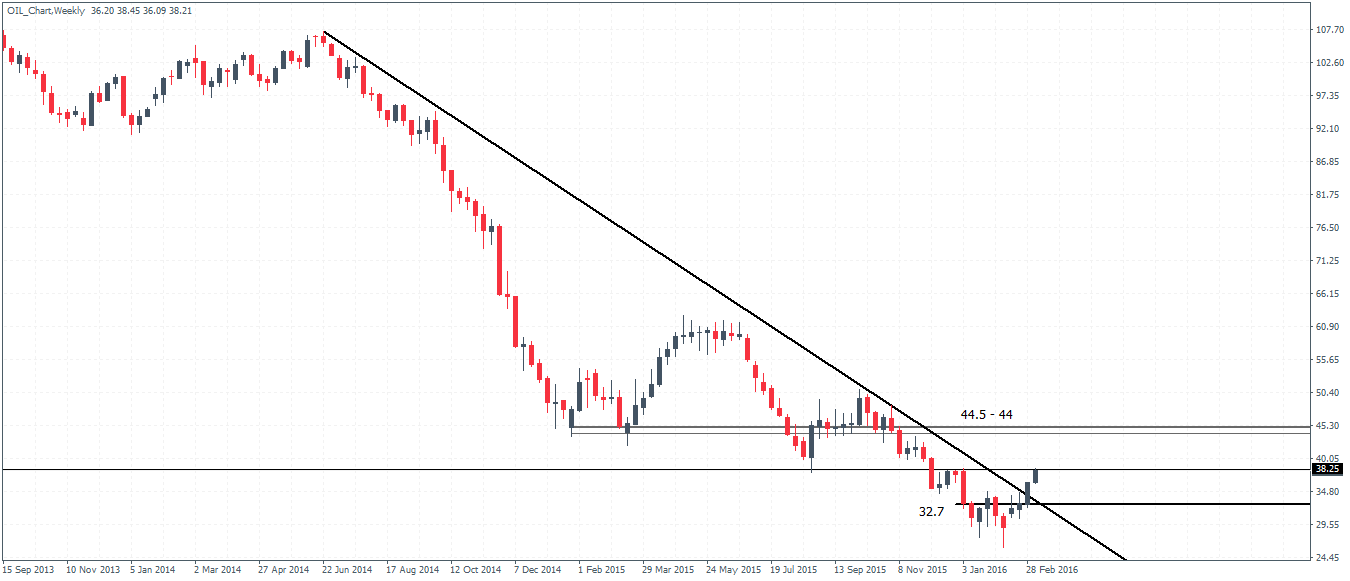
Oil prices have been bullish for the past three weeks and the upside momentum is likely to see price continue towards the $44 – $44.5 support. However, there is a risk of a retest back to the recently broken trend line near the $32.7 handle, especially if the 38.25 minor resistance caps the gains. Overall, Crude Oil prices are bullish on the weekly chart with the risk of a pullback to $32.70. Only a convincing close below the $32.70 handle could put the upside bias to question.
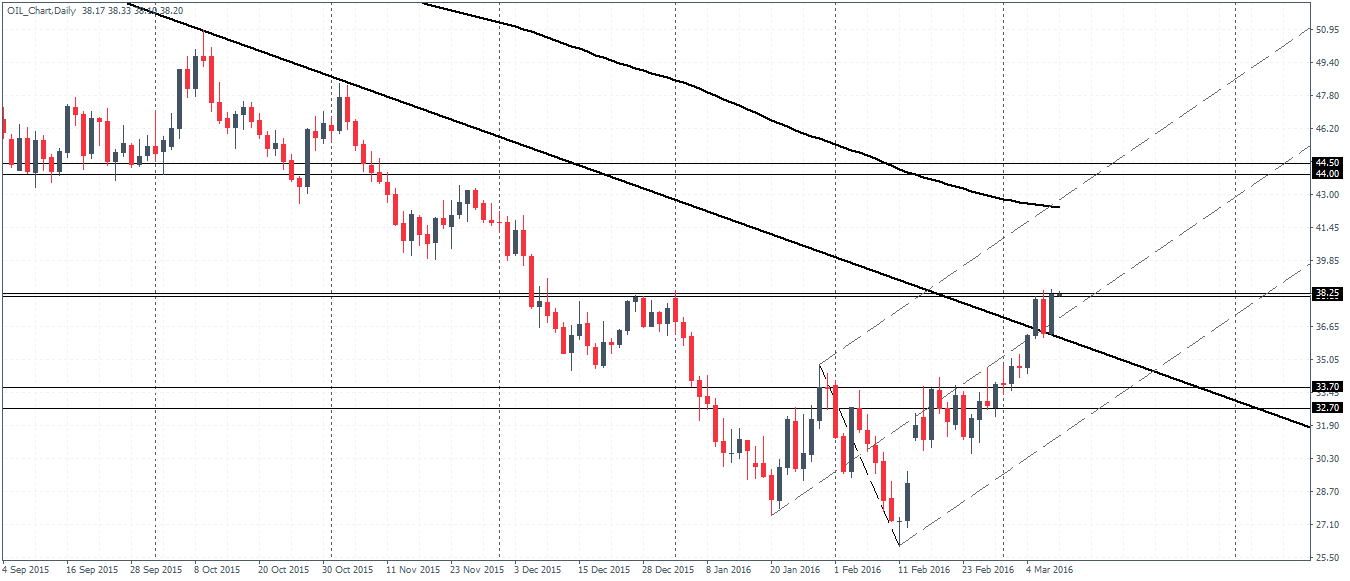
On the daily chart, price action has broken a very long term trend line which connected the highs of June 24th, 2015 at 61.56 and 9th September highs of 50.92. Prices are currently trading just below the identified broken support level near $38.25 – $38.10. This level was tested once briefly with prices declining strongly. If the current test of this support turned resistance level works, Oil prices could fall in the near term. A dip back below the long-term trend line will see a test towards $33.70 – $32.70.
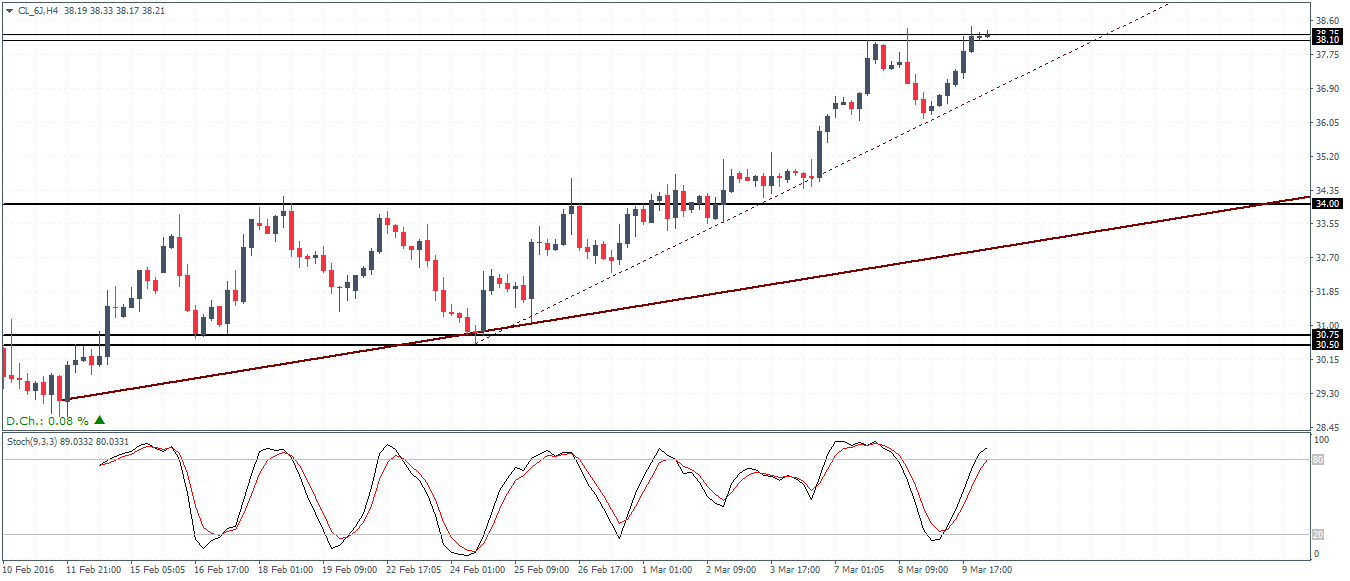
On the 4-hour chart, with the resistance level at $38.25 – $38.10 showing a decline to the downside could see a possible bearish divergence on lower highs printed in the Stochastics. This could potentially lead prices lower towards the $34 handle in the near term.
To conclude, Oil prices indeed look bullish in the next 3 – 4-week time frame with a possible test towards $44 – $44.5 levels. A pullback towards $34 handle with a risk of a decline lower to $33.70 – $32.70 could mark a low ahead of the longer term rally. Into next week, the Fed’s FOMC meeting and the March 20th OPEC/Non-OPEC meetings will likely be the key risks to look out for.

