
EURUSD (1.11): The single currency has started to ease back following the post-ECB rally. Failure to test the upper resistance near 1.123 signals a potential pullback with the upside bias in the near term likely to stay intact. Support to the current declines come in at 1.095 – 1.10 region which is likely to be critical in the short term. A break below this support could see EURUSD slip down to 1.081 – 1.075 support. The new median line sloping down shows the significance of the 1.095 – 1.10 support, which could potentially mean a decline lower if the support fails, this downside view is also further validated by the lower high posted against the previous highs above 1.13. In the short term, EURUSD is likely to remain under pressure as the FOMC meeting due on Wednesday edges closer.
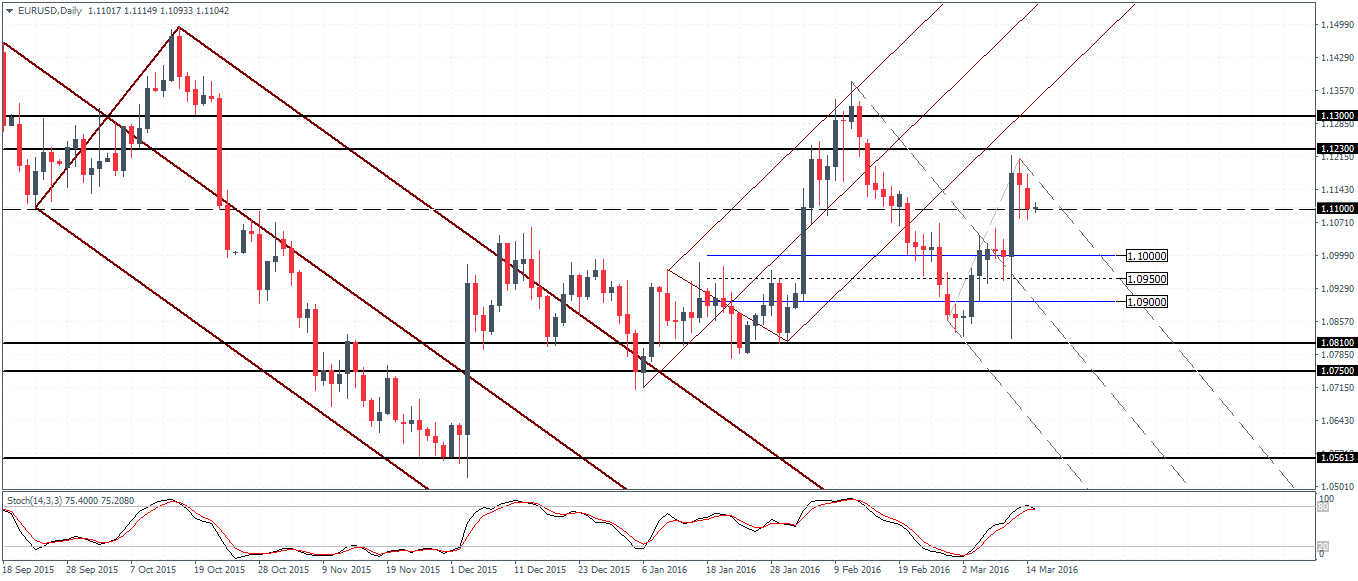
- Bias (D1): Flat
- Support: 1.095 – 1.10
- Resistance: 1.11
- Technical Forecast: FOMC will be the key event to see EURUSD breakout. Below 1.095/1.10, support at 1.08 – 1.075 will be open for a test while above 1.11, 1.123 will be the resistance level of interest
USDJPY (113.4): The consolidation in the price action since February 10th has seen USDJPY caught in a range. The minor inverse head and shoulders pattern being formed will be critical as a break above the 114 neckline support could confirm a new leg in USDJPY to the upside. The inverse head and shoulders pattern could see a minimum move to the upside towards 115 with the potential for a rally to continue pushing the Greenback towards the 117 resistance level, which is validated by the bullish divergence to the Stochastics and the support being established near 112.5 – 112.0 levels.

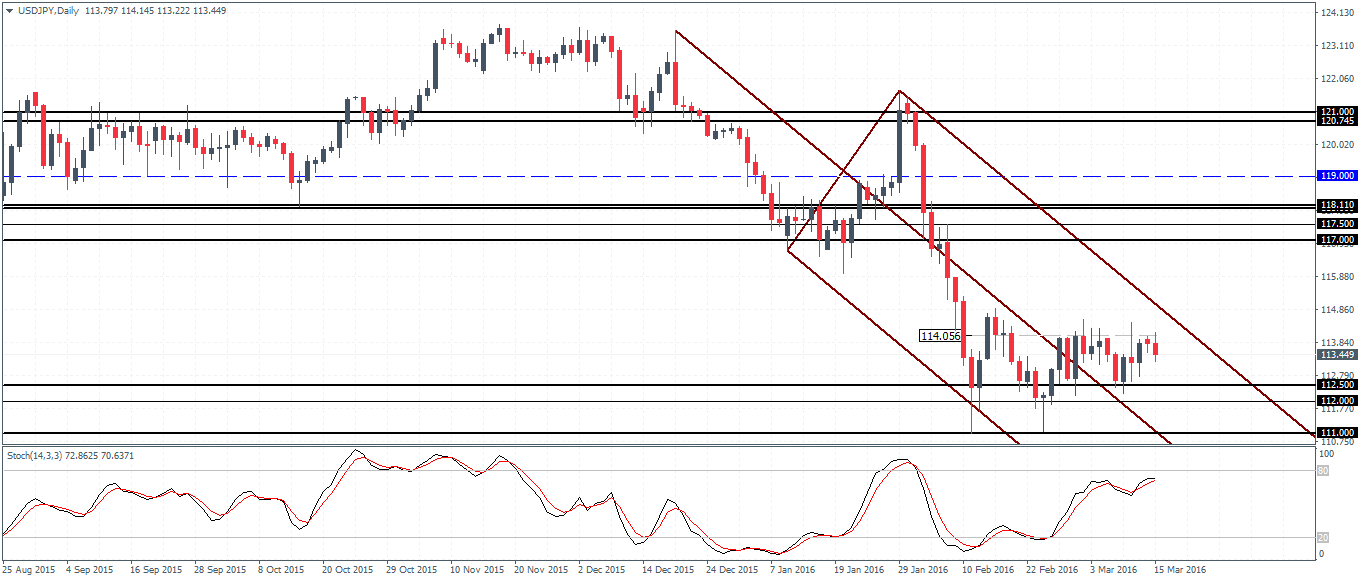
- Bias (D1): Upside
- Support: 112.5 – 112
- Resistance: 115
- Technical Forecast:
GBPUSD (1.42): The Cable has managed to breakout from the resistance level near 1.42 – 1.41 region. A decline lower could see this newly breached resistance being tested for support. Establishing support here could prepare GBPUSD for a new leg higher towards the 1.463 resistance level. Alternately if the support near 1.42 – 1.41 fails, GBPUSD could see a decline back below the falling trend line with bearish momentum, targeting the 1.40 handle. Below 1.40 there is scope for the currency to post new lows if it goes beyond the previous low near 1.3865. To the upside, the gains in GBPUSD will be limited to 1.4635 through 1.481 at the minimum. Above 1.481, GBPUSD could be looking to trade towards the 1.50 psychological level.
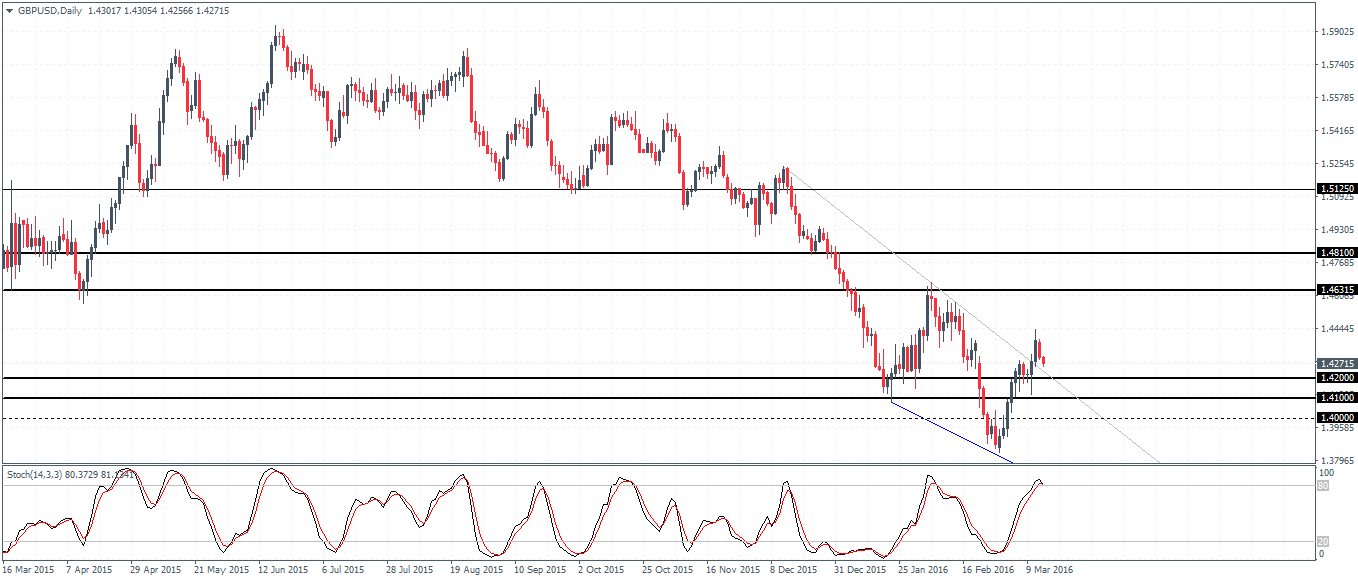
- Bias (D1): Upside
- Support: 1.42 – 1.41
- Resistance: 1.4631
- Technical Forecast: If 1.42/1.41 support holds, GBPUSD could be looking to reach for 1.4631. To the downside, below 1.41, GBPUSD could slip towards 1.40
USDCAD (1.32): Prices are showing signs of consolidation but gradual new lows being posted in price. 1.3136 is the critical support level which if breaks could see USDCAD fall towards 15th October 2015 lows of 1.2865. However, expect to see a bounce at the first instance to the support level, which could see prices attempt to test the resistance established near 1.346 – 1.3387. Above this resistance, the next level of interest will be 1.367 – 1.364 which could keep the gains in USDCAD capped.
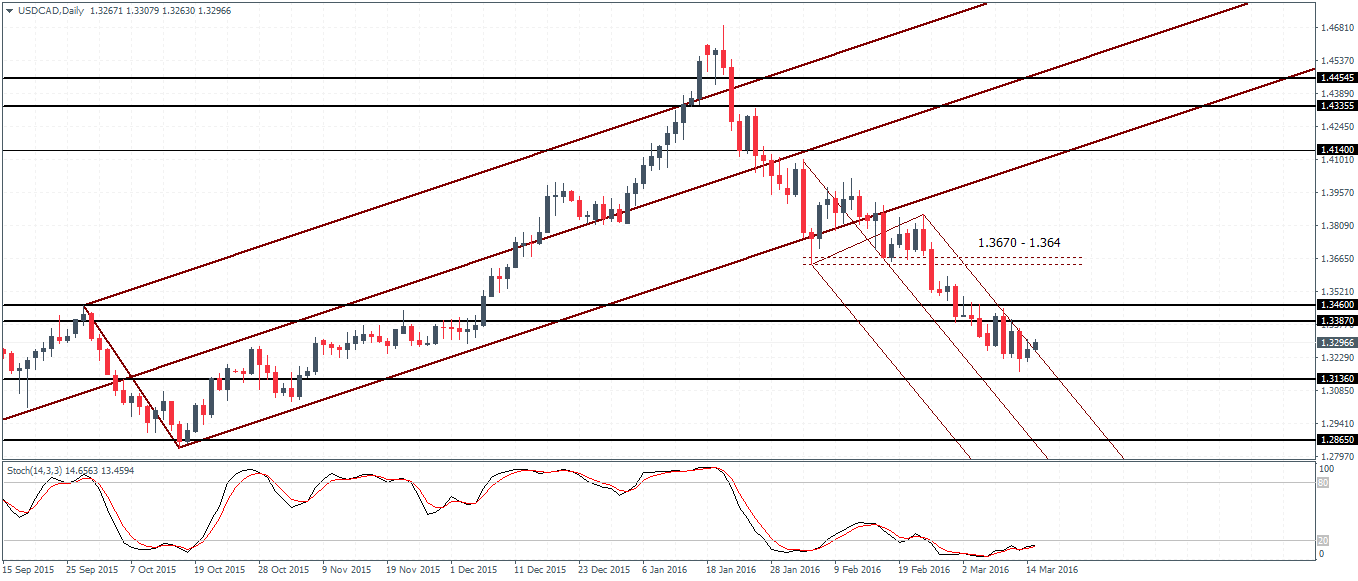
- Bias (D1): Downside
- Support: 1.3136
- Resistance: 1.346 – 1.3387
- Technical Forecast: Price likely to stay range bound at current levels with a breakout to the upside taking USDCAD towards 1.367 – 1.364, while to the downside, a test to 1.2865 will be likely
USDCHF (0.98): Following the steep bullish flag pattern, USDCHF has failed near 1.0045 level as we anticipated over the past reports. With prices now trading near 0.9928 – 0.9848, USDCHF could remain range bound into the SNB’s and the FOMC’s meeting over the week. Support to the downside is at 0.96665 while resistance if fairly strong to the upside. However, a break above 0.9928 could see USDCHF look towards another test to 1.0045 and potentially target 1.0150. To the downside, below the minor support at 0.96665, 0.9547 support will be the next big level to watch for.
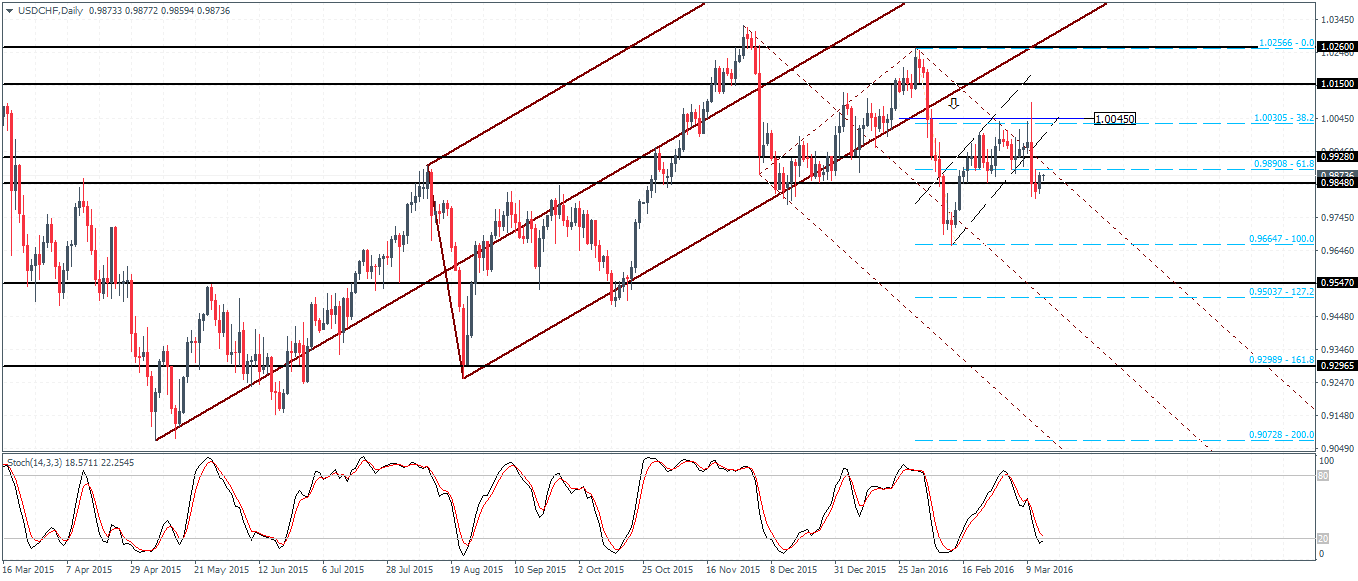
- Bias (D1): Downside
- Support: 0.9664
- Resistance: 0.9928
- Technical Forecast: The bias to the downside is more open with a dip to 0.9664. To the upside, resistance levels are strong at 0.9928 – 1.0045.

![Credit Card 160×600 [EN]](https://assets.iorbex.com/blog/wp-content/uploads/2023/06/13144507/Blog-Banner_EN-Banner_160X600X2.webp)