Following the Late December 2015 – February 2016 rally, Gold prices are showing signs of retreating after prices briefly flirted near 13-month highs. Repeated price rejections, failure to close above the 1275 handle has seen strong declines since last Friday, March 13th. On a week to date basis, Gold prices are down -1.41% while Silver prices are down by -1.31%. The declines in both the metals come ahead of the Fed’s monetary policy meeting due later today where interest are expected to stay unchanged. However, the Fed is likely to make it up with a hawkish statement reminding markets that rate hikes are still live, if not March then April or June at the very least with the Fed fund futures pricing a 50% probability for a rate hike in June.
The rally in Gold continues to remain in the spotlight. While earlier Goldman Sachs called the rally in commodities unjustified, other views are bullish with some analysts expecting to see Gold prices touch the $1300 handle, last seen in January of 2015.
Last week, it was the ECB’s meeting which kept Gold prices supported. Despite expanding the QE purchases by an additional 20 billion Euros and cutting rates across the board, the policy move from the ECB did little to push Gold higher. Indeed, on Thursday, March 10th, Gold prices did rally but failed to close above the 1275 and merely managed to post a high at these levels.
Gold – Technical Outlook

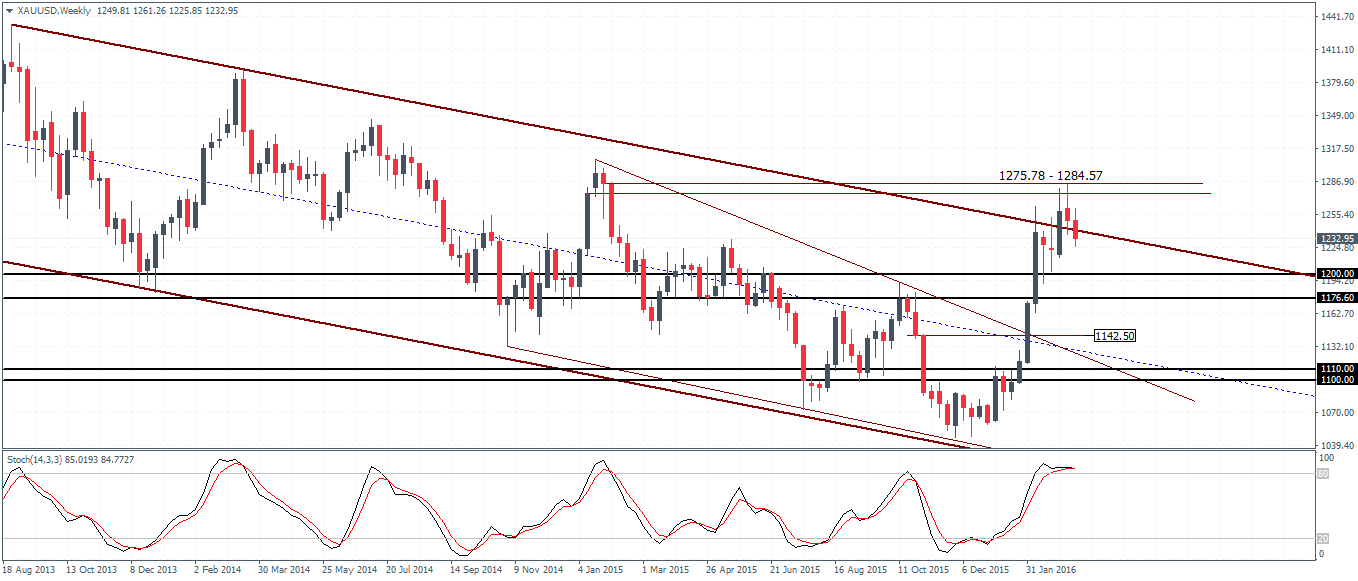
Starting with the weekly charts, Gold prices indeed shows a nice reversal near the $1275 – 1284 handle with prices posting a high at this identified resistance level. A weekly close this week will confirm the bearish reversal with prices likely to decline down to the $1200 – $1176 level of support.
On the daily chart, Gold prices broke out from the rising wedge pattern and cleared the all-important 1250 support. We expect to see a near-term pullback to the $1250 and establishing resistance here will clear the way for a confirmed move to 1200 which marks a psychological level, below which the main support at 1186 – 1178 comes in.
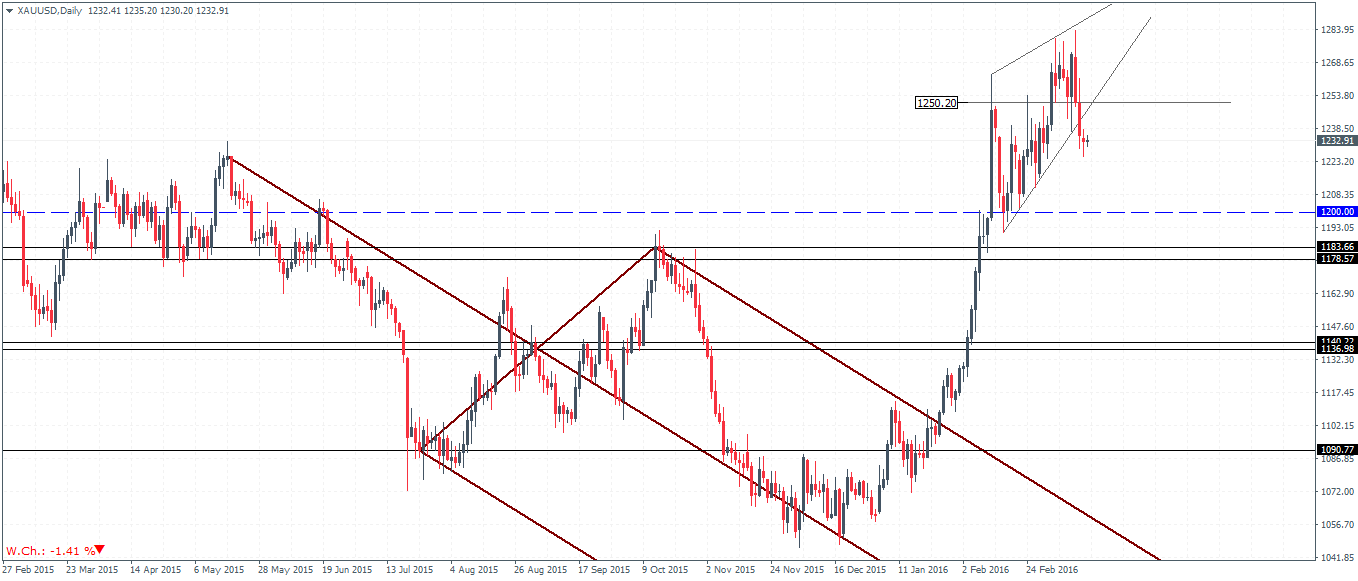
In conclusion, our view in Gold remains the same, which is a downside bias towards $1200 with a risk of a pullback to $1250 broken support to establish resistance. Below $1200, a test to $1184 – $1180 will most probably hold the declines for the near term. A break above $1250 could, however, put the bearish bias at risk but Gold could continue to stay weak above $1250.
Silver – Technical Outlook
Silver prices closed in a bearish spinning top pattern last week and followed up with bearish price action so far this week. A confirmed weekly close preferably below last week’s low at $15.15 could confirm the view that Silver could see further downside for another test down to $14.60.
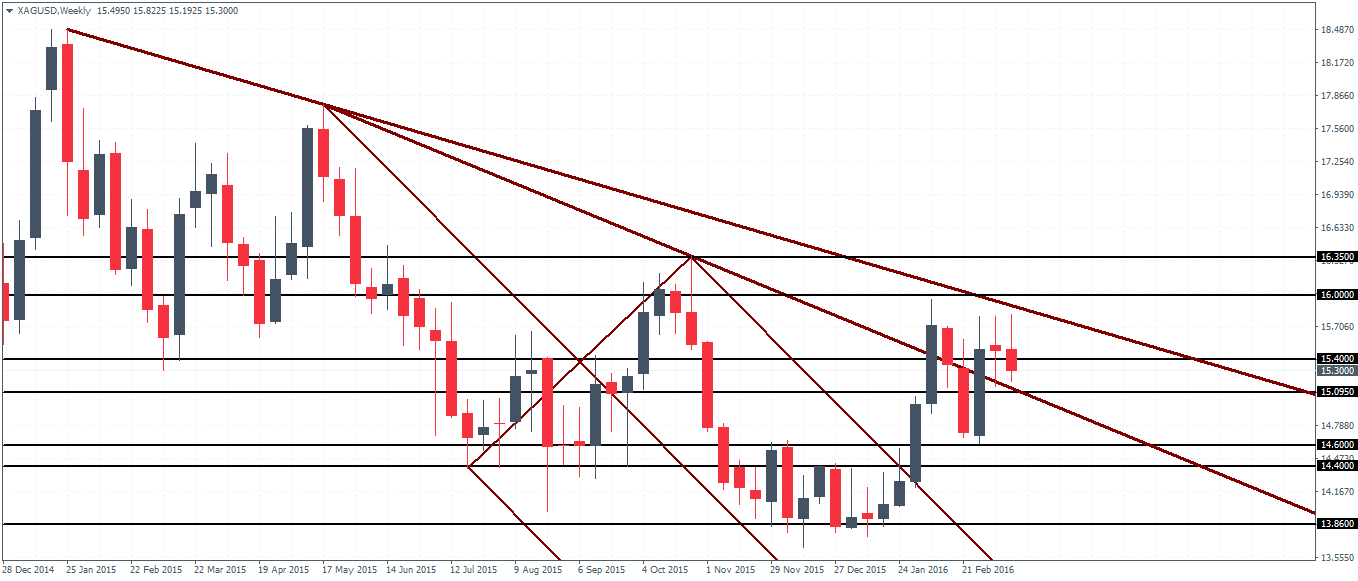
On the daily chart, following the dynamic support near the $14.65 levels, Silver prices rallied back to test the resistance level at $15.70, marking the second test to this level within a month. Plotting a new median line to the recent price action, Silver prices show an inclination towards dipping towards $14.72 – $14.65 support in the near term. A break below this level could see more support coming in at $14.40.
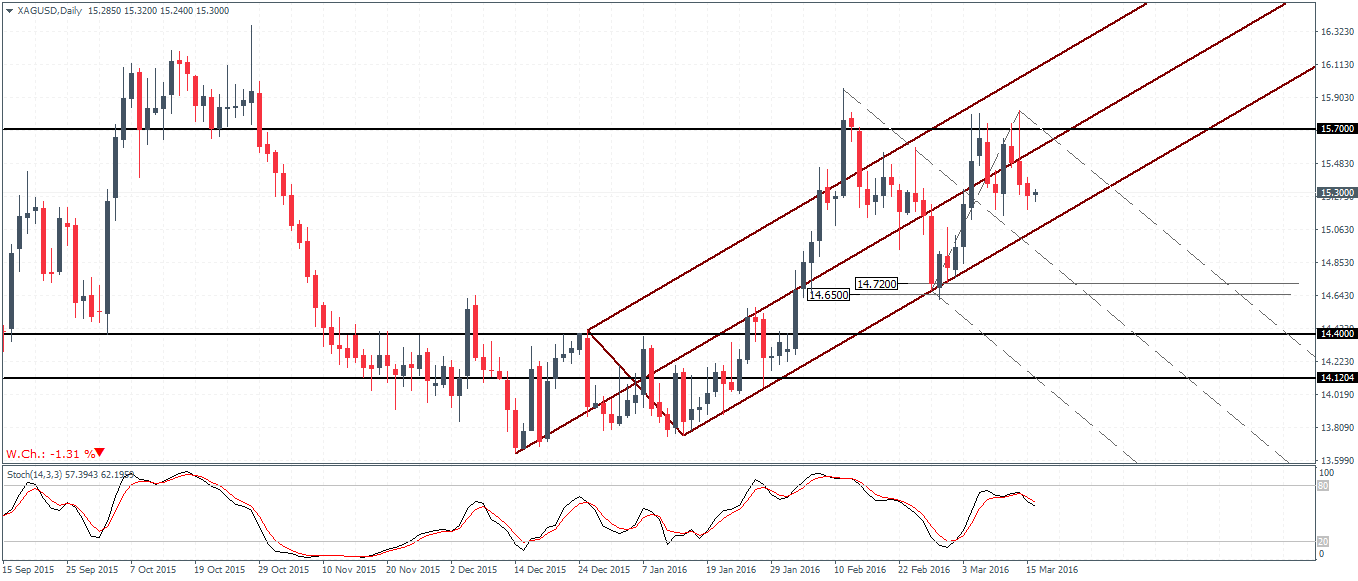
In conclusion, Silver prices are likely to dip lower following a bearish close on the weekly chart. Support comes in at $14.72 – $14.65 in the near-term with a potential to decline towards $14.40.

