
For a currency that was expected to continue to push higher, heralded by a change in monetary policy with a 25bps rate hike in December, the US Dollar fell across the board this week. The Dollar Index now sits at 96.65, breaking below December 2015 lows. The turnaround in the US Dollar this week was rather significant with four straight sessions of declines. For most traders who were long on the US Dollar, this week would have been a nightmare. So why did the US Dollar fall this week and what’s in store?
An honest answer to the above is that only Mr. Market knows. In hindsight, it is easy to attribute one, if not many reasons to this week’s declines in the USD. However, let’s take a more objective approach to this.
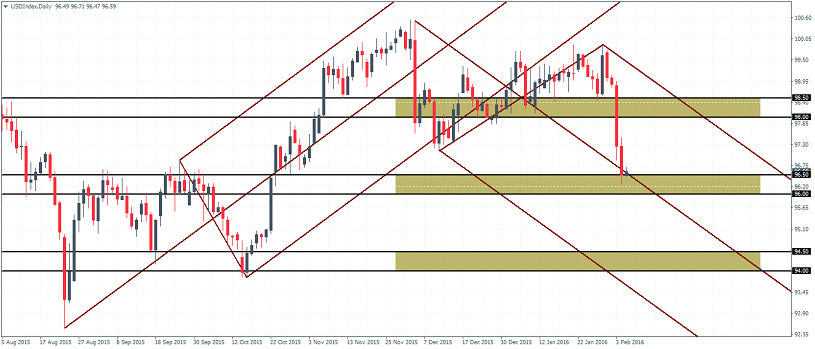
USD Technical Outlook
The Dollar was showing signs of failing near the 100 psychological level since mid last year. There were a few attempts to break above 100, but the price quickly fell back. After the first attempt to break the 100 level in March 2015, the US Dollar Index made a second attempt to break above 100 in early December 2015, following a more recent price failure at 99.5. For those reading the weekly US Dollar Index analysis, it should not come as a surprise, as our January 22nd analysis noted that the US Dollar Index was looking weak to the downside, with a correction to 97.28 well overdue. Well, the Dollar Index fell to 97.28 and dipped lower to 96.26 before closing back at 96.55 as of yesterday.

From here, on, we expect to see a potential move back to the upside, if the support at 96.5 – 96 holds. The small rally we anticipate is, however, going to be short-lived as a test to the 98.5 – 98 resistance makes it difficult for the Dollar Index to break higher. To the downside, from the test of resistance at 98.5 – 98, the Dollar could well again find support near 96 – 96.5 while a larger decline is expected to test the lower support at 94.5 – 94.
USD Fundamental Overview
From a fundamental perspective, investor mood turned sour since late December. The much anticipated ‘Santa Rally‘ didn’t quite materialize and by January China’s weak PMI readings made for a correction in the equity markets. As a result of the risk aversion, the Yen strengthened, leading the Euro to also gain as a result. Around the same time, economic data from the US started to weaken, more importantly, the ISM manufacturing which is now into its fourth month of contraction with a steady reading below 50.
Fed officials in recent weeks have also sounded doubtful on the state of the economic affairs in the US. Indeed, with almost all Central banks forecasting inflation to stay low and with monetary policy either looking to the downside with rate cuts or staying flat, it was only a matter of time before the markets started to question the rate hike prospects from the Federal Reserve.
The Fed’s next big meeting is in March and it is unlikely that there will be a rate hike then. In the interim, the US Dollar sits at a critical level. Based on the technical outlook, only a break above 98 – 95 will signal a bullish continuation. For the moment, the Dollar is likely to seek support from 96.5 – 96 level which could see a move back to 98.95. In the medium term, the Dollar Index is likely to range between these two levels. But watch for a break below 96.5 – 96 which will open the gates for a steeper decline to 94.5 – 94.

![Credit Card 160×600 [EN]](https://assets.iorbex.com/blog/wp-content/uploads/2023/06/13144507/Blog-Banner_EN-Banner_160X600X2.webp)