
EURUSD (1.09): The sideways price action in EURUSD is potentially pointing to a buildup of momentum ahead of a breakout. Price action, however, is indecisive at the moment paving the way for a breakout of prices in either direction. The established Median line shows prices having formed a base near 1.081 – 1.075 region, with multiple tests to this support. The new median line shows a support level being formed near 1.0872 – 1.0892 region. Price action needs to see a close above this level and a potential pullback in order to establish this support. In such a scenario, EURUSD could see a potential to rally towards 1.11 which marks the immediate resistance level and if broken could see a test to 1.123. To the downside, failure to establish support near 1.0872 – 1.0892 could keep EURUSD range bound, and the bias shifts to the downside on a break below 1.081 – 1.075 support, which could see EURUSD decline to 1.0561 levels.
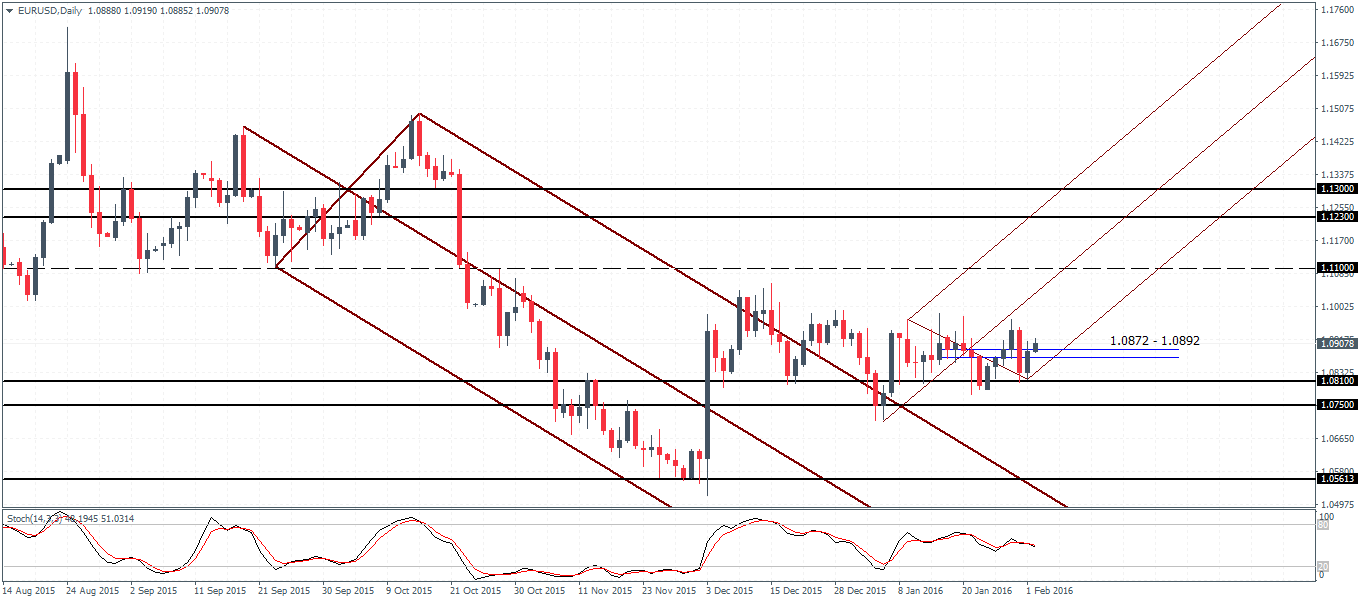
- Bias (D1): Sideways
- Support:081 – 1.075
- Resistance:11
- Technical Forecast: A move to 1.11 resistance is possible if EURUSD stays above 1.0872 – 1.0892 support.
USDJPY (120.6): USDJPY lost momentum after rallying off 118.11 – 118 support to test a previously established support near 121.22 – 120.745 level to test for resistance. The reversal seen near this price level is likely to see USDJPY decline back to the previous support to re-establish resistance. With prices staying below the resistance level of 121.22 – 120.745, we expect to see a correction in USDJPY ahead of further rallies. In the rundown to 118.11 – 118 support, we expect to see a minor support coming in at 119 level which could offer some bounce. For the moment, however, USDJPY remains biased to the downside as long as the resistance of 121.22 – 120.745 holds.

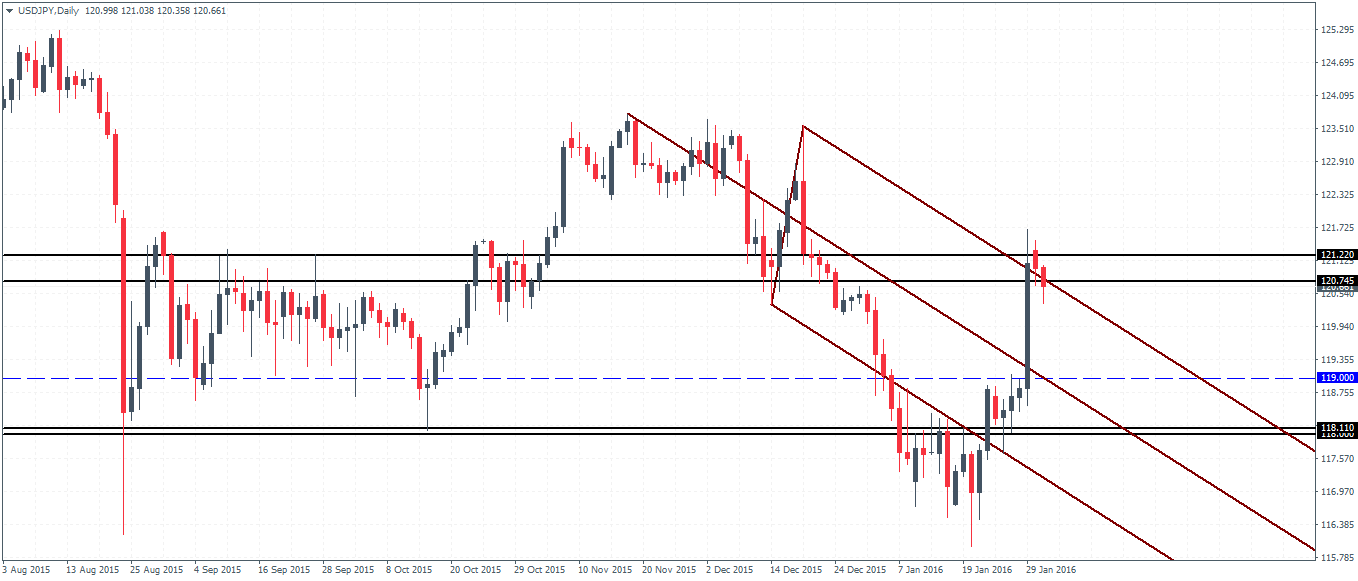
- Bias (D1): Up
- Support:11 – 118.0
- Resistance:22 – 120.745
- Technical Forecast: Correction to 119, followed by 118.11 – 118.0
GBPUSD (1.43): GBPUSD is looking for a base near the 1.42 – 1.41 region after bouncing off strongly on the first contact. The medium term bias in GBPUSD remains to the upside with 1.46315 region coming in a strong level of support which could be tested for resistance. The Stochastics oscillator on the daily chart shows a hidden bearish divergence based on a higher high being formed on the oscillator against price’s lower high. A retest to 1.42 – 1.41 region could potentially set the stage for GBPUSD to embark on a medium-term correction in prices to 1.4631, followed by 1.481.
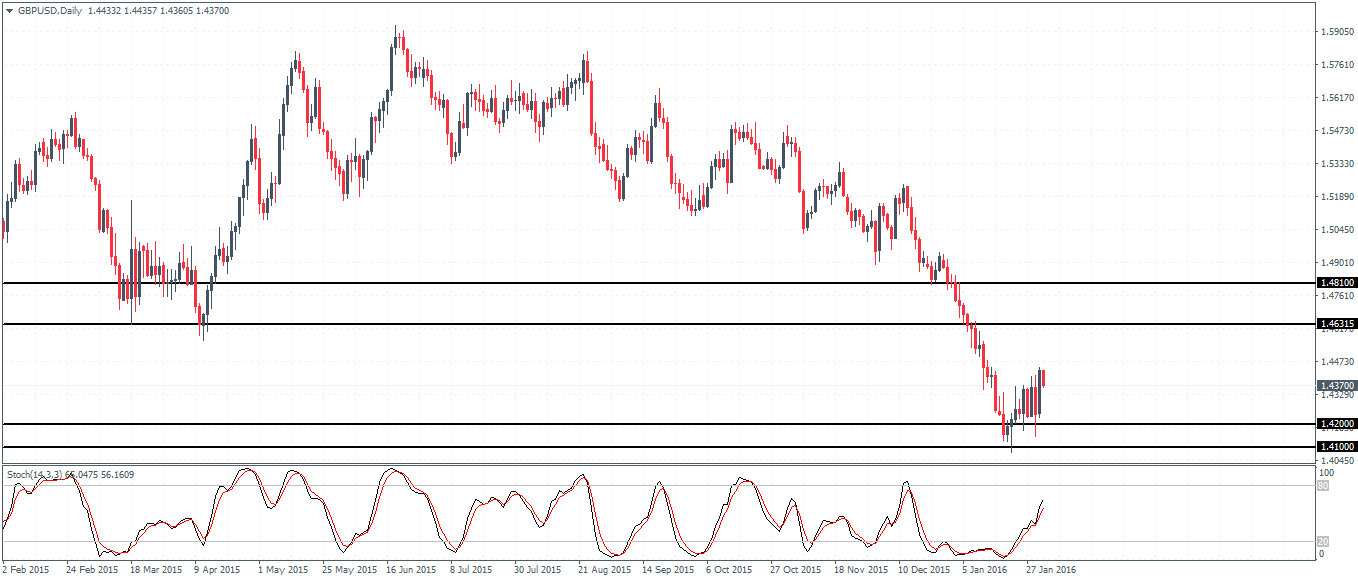
- Bias (D1): Sideways
- Support:42 – 1.41
- Resistance:463 – 1.481
- Technical Forecast: Potential base forming near 1.41 – 1.42 which if validated could see a move to the mentioned resistance level
USDCAD (1.40): USDCAD declined off the highs near 1.469 to test the previous minor support at 1.3958 – 1.3914. If this support level holds, USDCAD could be looking at the move to the upside to retest the previous minor support near 1.43355 – 1.44545 region. Establishing resistance at this level is likely to see USDCAD look to a new leg in declines with the eventual target to 1.345 – 1.338 support level. However, should the resistance zone bear 1.44545 – 1.43355 give way, USDCAD could easily post another new high on a bounce back to establish support near the newly broken resistance level.
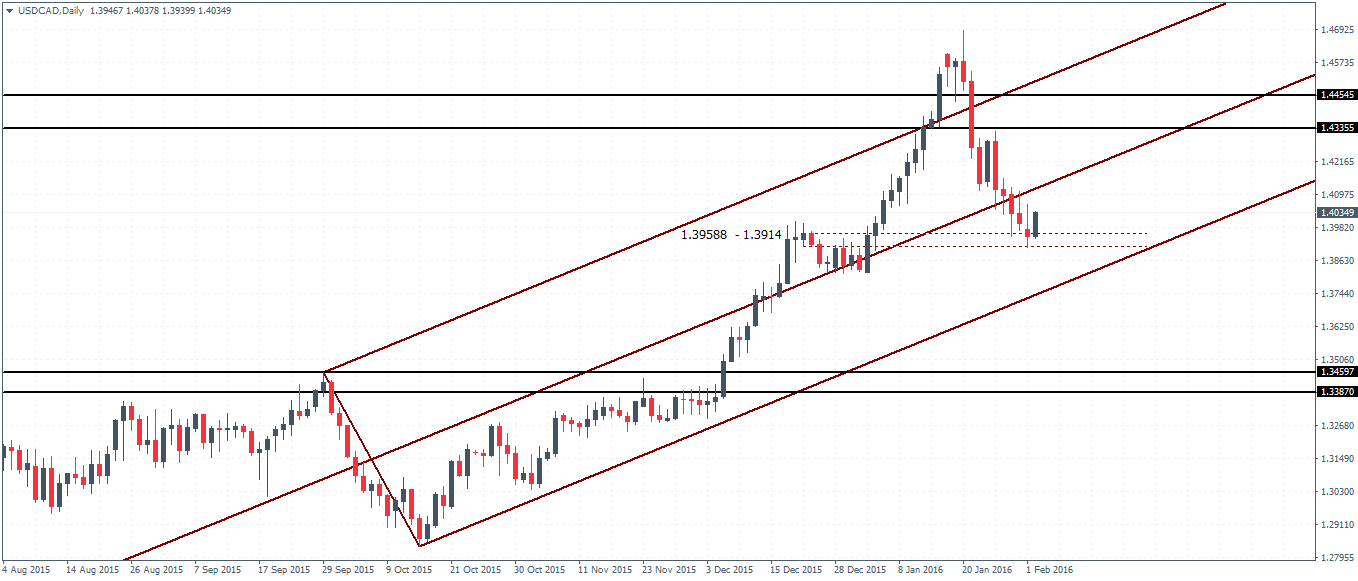
- Bias (D1): Sideways
- Support:3958 – 1.3914
- Resistance:4454 – 1.4335
- Technical Forecast: Establishing resistance near 1.4454 – 1.4335 could mark a new leg lower in USDCAD with a test to 1.345 – 1.338 on a break below 1.3958 – 1.3914
USDCHF (1.019): USDCHF is currently attempting to break above 1.026 level in order to post a new high. However, the resistance level here looks strong as the currency pair could be potentially looking at a test back 0.9928 – 0.9848 level of support. The Stochastics oscillator currently shows a bearish divergence pointing to a correction down the support levels mentioned. The price level of 1.026 – 1.015 is key as a break below 1.015 could mark the start of the decline. However, there is scope for price action to stay consolidated within the mentioned level of resistance following a breakout in either direction.
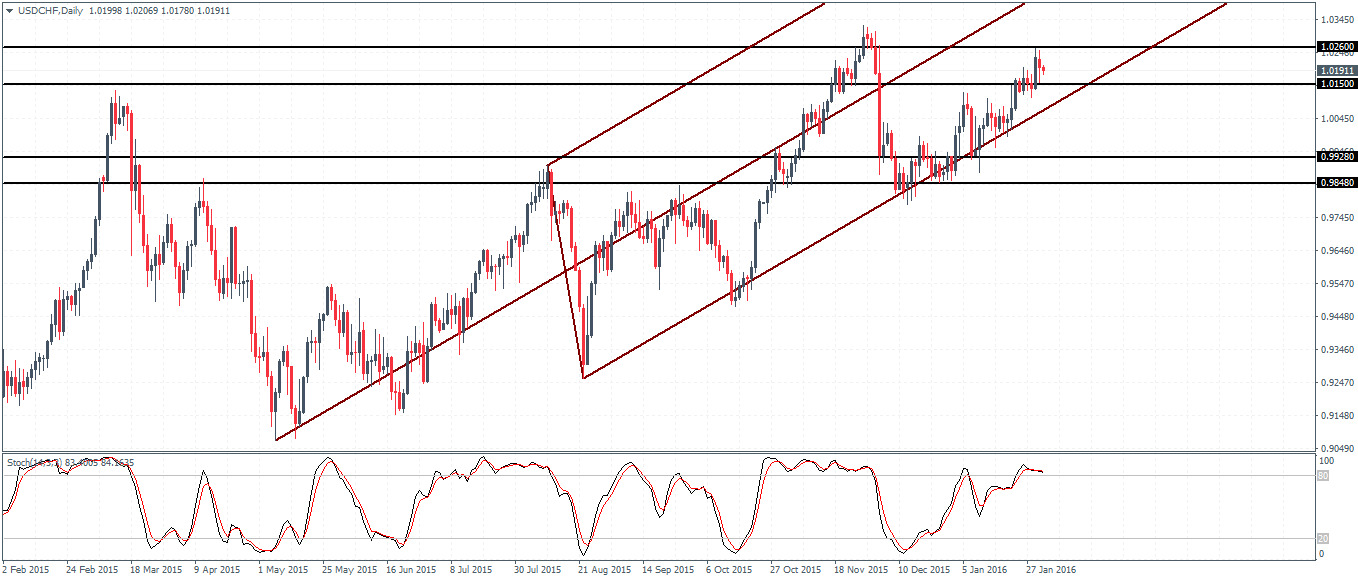
- Bias (D1): Sideways
- Support:9928 – 0.9848
- Resistance: 1.026 – 1.015
- Technical Forecast: Correction to the mentioned support levels likely if prices fail to break above 1.026 resistance high

![Credit Card 160×600 [EN]](https://assets.iorbex.com/blog/wp-content/uploads/2023/06/13144507/Blog-Banner_EN-Banner_160X600X2.webp)