
The precious metals markets show no signs of letting go of the bullish momentum with Gold attempting another go, supported above the $1200 psychological level. Silver prices, on the other hand, look to be supported above the $15 psychological support level as risk aversion shows no signs of abating. On a week to date basis, however, Gold and Silver are trading weaker, down -0.23% and -0.82% respectively.
Gold – Technical Outlook
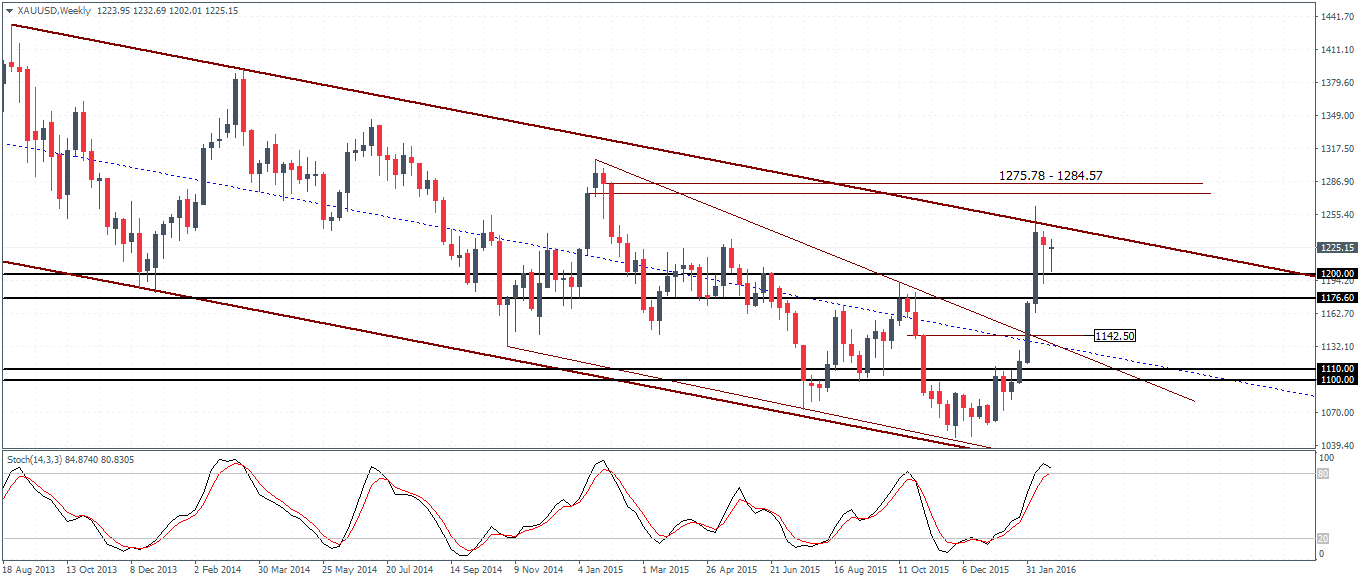
Following last week’s price action, Gold remains range-bound within last week’s high and low and overall is poised to trade another week within February 7th’s price range of 1263 and 1164, despite opening this week with a down gap. How this week’s price action will close, will be critical to the near-term outlook for Gold. From the looks of it, the upside in Gold is likely to be capped unless we see a new bullish momentum push prices higher. But the lack of any support being established is likely to see the rallies being faded. On the weekly chart, 1200 – 1176 remains a key price zone of interest.

Shifting the views to the daily chart, Gold is stuck in the 1239 and 1200 range with no clear pattern emerging as of yet. However, it would be safe to assume that a near-term top looks to be forming in Gold, but one, which needs a confirmation only on a break below 1200. The Stochastics oscillator is printing a lower high compared to the higher high near 1108 levels formed in early January this year. A break below 1200 will, of course, see Gold decline back to establish support near the 1108 level in the medium term. The view shifts back to the upside only a break above 1239 with a potential support being established near the previous highs.
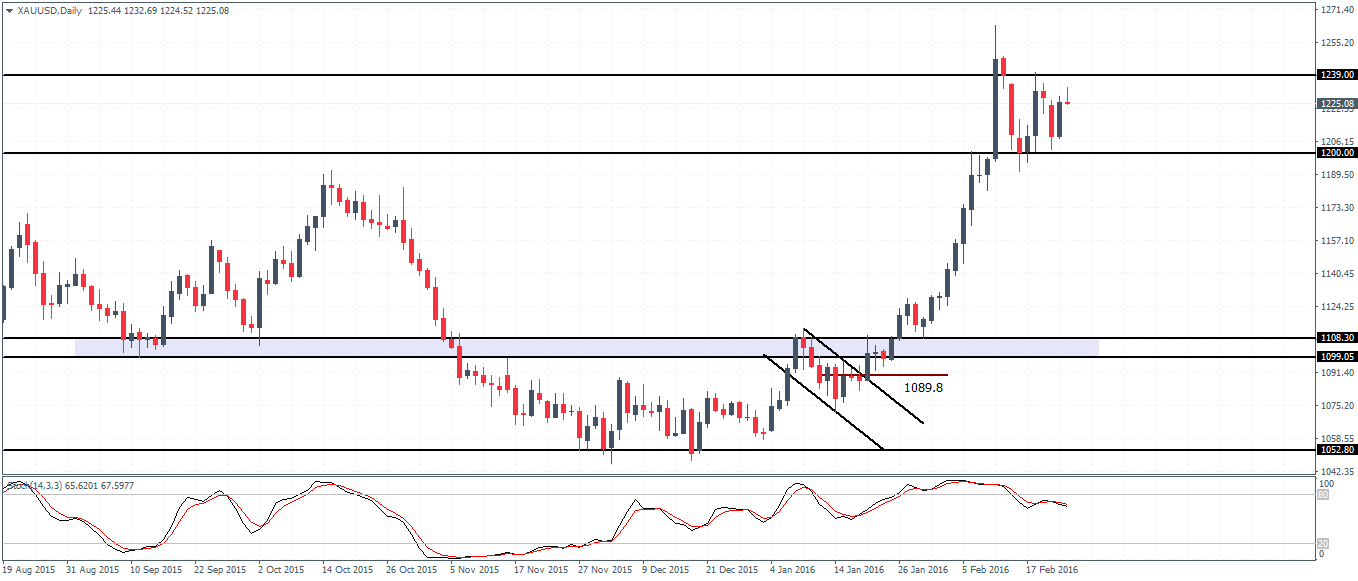
In conclusion, Gold could remain range bound within the 1239/1240 through 1200 region with a break below 1200 signaling a decline to 1108 through 1110 support.
Silver – Technical Outlook
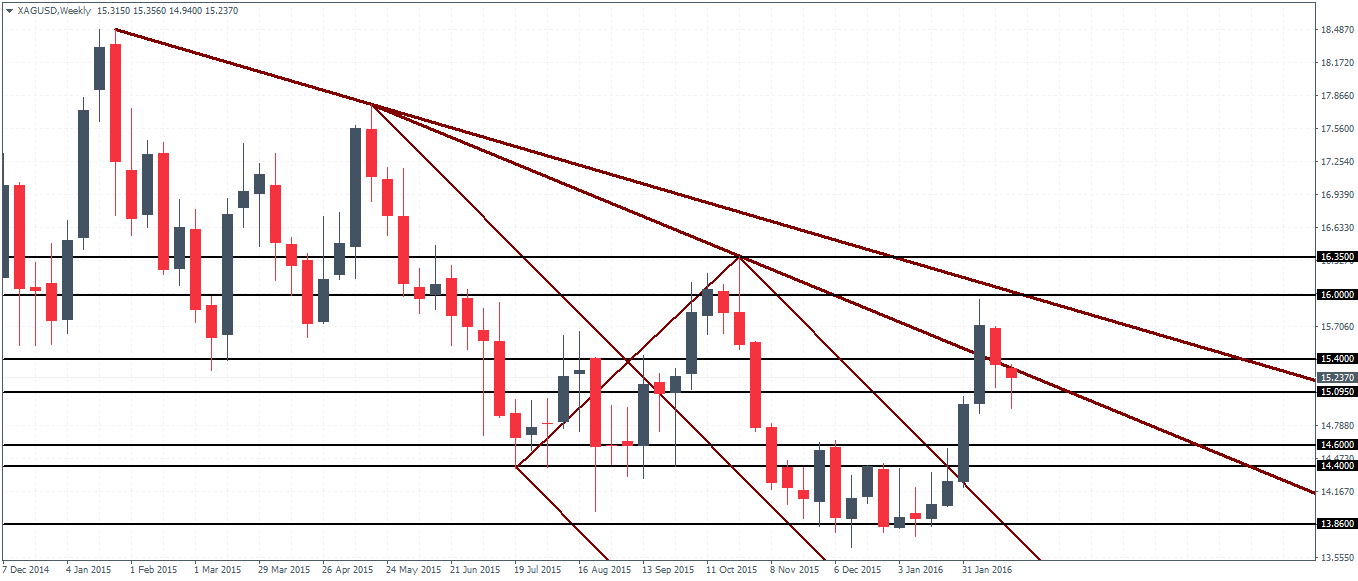
Silver prices are also showing signs of the bullish momentum easing following a test to $15.9 region. Prices retreated last week and formed an inside bar off the weekly time frame, but prices remain supported near the 15.4 – 15.0 price zone. This week’s price action will be critical to further bias in the near term as prices are seen to be currently struggling near the trend line connecting the 17th May and 25th October 2015 highs of 17.77 and 16.36 respectively. Below the $15 psychological level, Silver could dip to 14.60 – 14.40 support.
On the daily chart, Silver prices are looking to bounce off the Median line following the test to 15.7. So far, prices have formed a lower high at 15.45 and as long as Silver trades below the $15.45 handle, there is scope for a downside correction on a break below the previous low at 15.20.
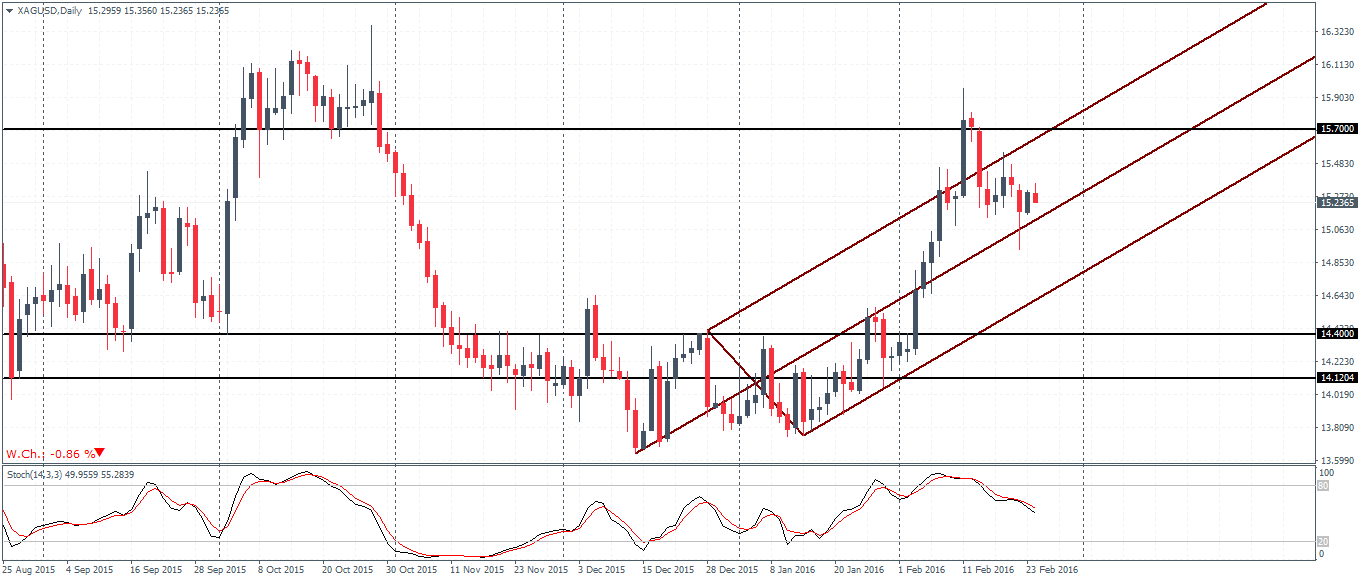
To conclude, Silver prices are likely to stay flat with upside momentum building up on a break above 15.45 while to the downside a close below 15.20 on a daily time frame could signal a move to 14.40.

