The US Dollar index has been trading flat for the week after establishing a range of nearly 1.585 points since this Monday. The volatile price action came about as renewed concerns of slowdown from China which saw the flight to safety. Indeed, investors preferred to shed the US Dollar in search for safe haven assets such as Gold and the Japanese Yen.
The Euro also managed to piggyback on the Dollar’s weakness as a result. The US Dollar Index is likely to see more volatility as Chinese authorities continue to intervene in the markets with speculation rising that the Yuan could weaken further to the US Dollar. However, all said and done, the big test for the Dollar index comes with today’s NFP report for the month of December.
The ADP private payroll numbers which were released on Wednesday showed a robust growth in private payrolls, which increased 257k against estimates of 193k. However, the markets aren’t looking to the ADP numbers as a reflection of the NFP on account of strong revisions to past data that the ADP is prone to.
That said, today’s NFP expectations is for the US economy to have created 203k jobs while the unemployment rate is expected to stay unchanged at 5.0%. With the US rate hike cycle in process, the jobs report for December will not be as significant as that of January’s report which would mark a full monthly cycle to gauge the US labour market after tighter monetary conditions.

US Dollar index – Technical Analysis
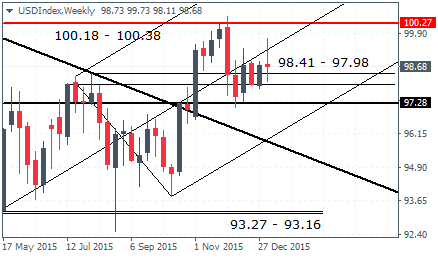
The weekly chart for the US Dollar Index shows price consolidating below the 100 and above the 97.5 levels. The weekly chart does not show any conclusive evidence of a bias at the moment, but traders should note the considerably lower high being formed at the moment. A break below 97.28 against this lower high could, however, signal a correction at the very least. From a support level point of view, a break below 97.28 could see a sharp decline down to 93.27 – 93.16 where the next key support level comes into the picture.
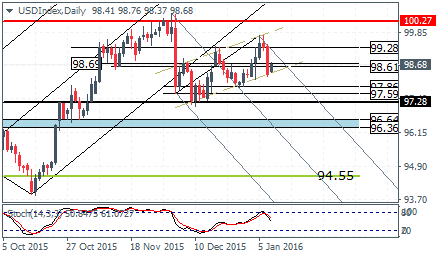
On the daily chart, price action is trading at a critical juncture with the support/resistance of 98.61/98.69 playing a key role. Failure to close above this level on a daily session could potentially signal a move to the downside with 97.28 coming in as the first level to watch for. To the upside, an alternative view being that a break above 98.61/98.69 could signal a renewed bullish moment which could potentially see a test back to the 100 psychological resistance level.
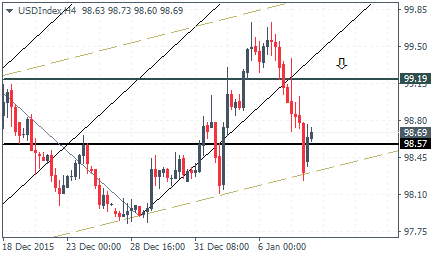
Last but not the least, the 4-hour chart for the US Dollar Index shows prices bouncing off the price channel after breaking out from the median line channel on failure to test the median line. The current bounce could see a potential retest back to the breakout level near 99.19 region. If prices are capped at this level, the US Dollar index could remain range bounce on the short term between 99.19 and 98.57 before breaking down either to the upside side or below 98.57. Of course, in the event that the Dollar index breaks the equidistant price channel, we could expect a correction to the downside as noted above.