
The US Dollar Index has been rather choppy over the week but with price action trading off 98.41 – 97.98 support, the bias remains to the upside with the price point of 100 now in focus. Economic data from the US over the week has been relatively soft with the exception of the monthly nonfarm payrolls which managed to come out strongly including previous upward revisions. With the US labour markets posting strong growth, the Fed is likely to stick to its hawkish tone in the statement while inflation is yet to show signs of a pickup. Today, the US producer prices index will be released, where expectations are dovish after rising 0.30% previously. Weak PPI numbers could potentially see inflation stay flat yet again for another month alongside the recent strong momentum led declines in Oil prices which are likely to keep food and other volatile components subdued.
US Dollar index – Technical Analysis
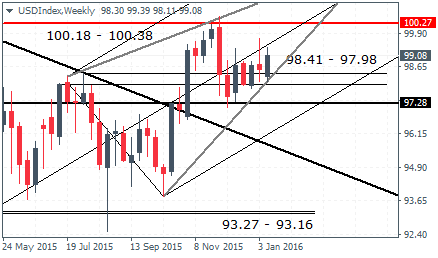
The Weekly chart shows prices finding support near the 98.41 – 97.98 support but with the median line acting as a dynamic resistance, prices are unlikely to post strong gains especially with the 100 level just a few ticks away. Furthermore, prices are trading in a strong rising wedge/consolidation pattern below the 100, meaning that unless prices break above 100 and potentially establish resistance, the US Dollar Index could be at risk of a breakout to the downside. Of course, 98.41 – 97.98 support could hold prices but given the level of consolidation taking place at this support, it is expected that the support could give way. A breakout from the rising wedge of the US Dollar’s Weekly chart could signal a move lower to 93.27 – 93.16 region.

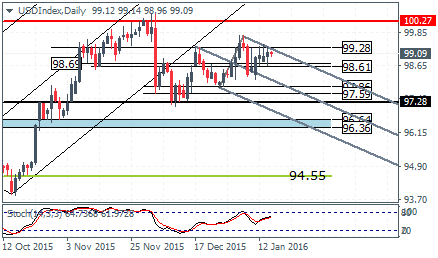
On the daily chart, the US Dollar Index remains trading within a price channel, below the 99.28 resistance level. The new median line plotted shows that in the event of a failure to break out above 99.28, prices could very well be looking to decline lower with a potential test to 97.28 and eventually to the support zone near 96.64 – 96.36 region. The declines could, however, remain choppy on account of the minor support/resistance levels marked on the chart.
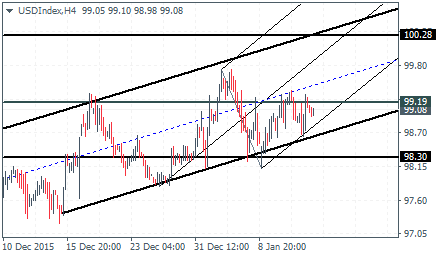
Finally, on the H4 chart, price is seen to be trading inside the rising price channel but remains below 99.19 resistance despite a few attempts to close above this resistance level which has failed and therefore, a move lower could see dynamic support being offered by the median line near 98.70, of which prices could bounce back higher. Failure to close above 99.19 on the H4 time frame could potentially signal an early reversal to the downside, with 98.30 coming into the picture as the next support level to watch for.
To conclude, the US Dollar Index could potentially (re) test the 100 level but only a strong breakout above this level will signal further gains. The risks are poised to the downside on a failure at 100, which could see a long-term decline to the support at 97.3.

![Credit Card 160×600 [EN]](https://assets.iorbex.com/blog/wp-content/uploads/2023/06/13144507/Blog-Banner_EN-Banner_160X600X2.webp)