
The recent market turmoil and rather mediocre economic data from the US have definitely brought out the doubts on whether the Federal Reserve would be able to offer four rate hikes in 2016. Gold prices have made some strong gains as the extreme risk-off sentiment saw the safe haven precious metal being preferred over the risky assets. In fact, since the start of this year, Gold has gained 5.0% and has been the focus for many. If the equity markets continue to throw tantrums, it wouldn’t be that hard for Gold to test the $1200 levels easily. In our yearly analysis on what to expect from Gold, mentioned here we noted that Gold prices remain poised to the upside above the 1095 handle with a potential test to 1233 – 1200 region. However, make no mistake that commodities are still in a bearish cycle and the medium-term moves to 1200 – 1233 is merely a retracement as this price level could easily come in as resistance with more downside in store for Gold.
Gold – Technical Outlook
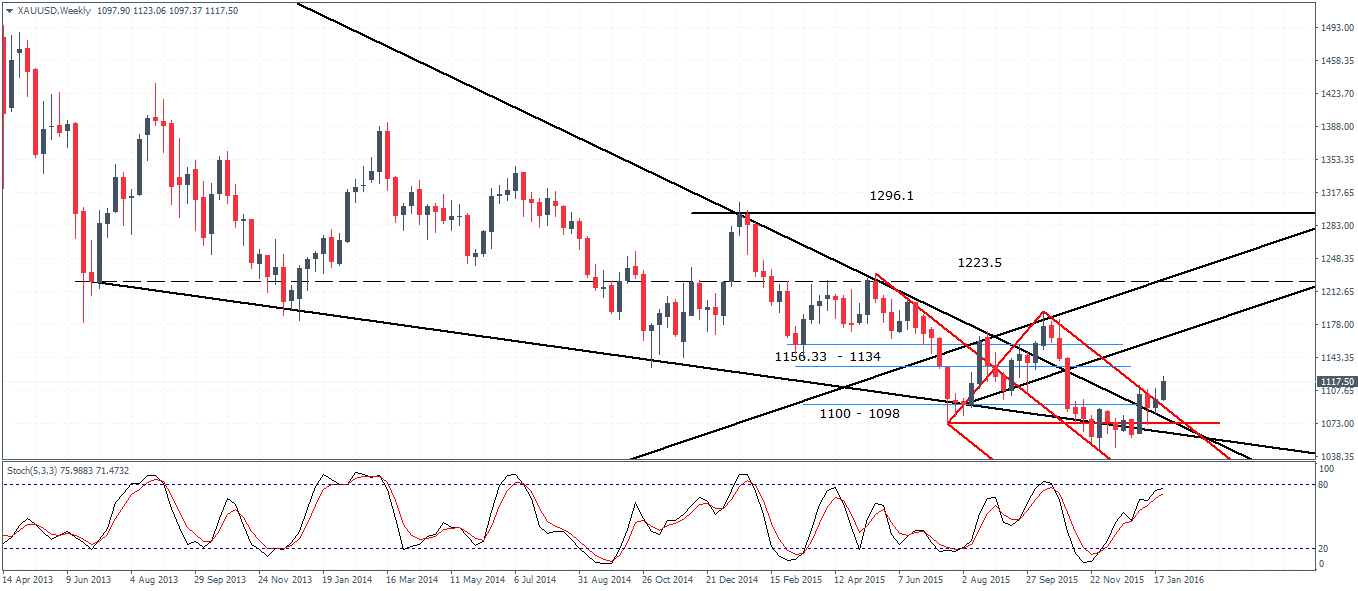
Starting with the Weekly chart for Gold, we notice that prices have managed to break out from the falling median line (red). The upside target is likely to see Gold test the 1156 – 1134 resistance level and prices could initially tip back lower to the 1100 – 1098 region to establish support ahead of a further rally. There is evidence of a basing pattern formed near the 1100 – 1098 price zone which is likely to hold prices and form the bias to the upside. With a monthly close above 1088 now coming in as a likely event, it would mark a strong bullish close above December 2015’s doji high signaling a further move higher.

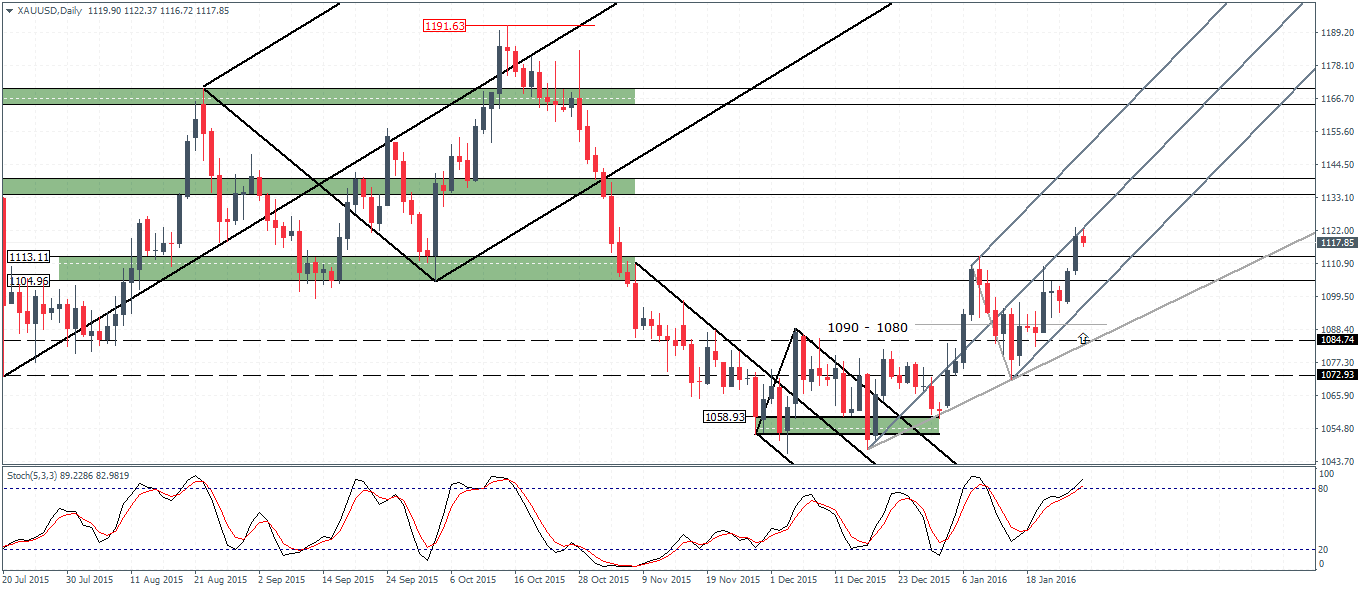
On the daily chart, price action is currently bearish after the initial touch to the median line yesterday near the 1120 region. If we get to see a bearish close today, then watch for the support near 1113 – 1104 level. A close below this price zone could trigger a sharper decline to 1090 – 1080 level which is a strong support level. A bounce off here could signal a move higher on a break of the previous support/resistance near 1113 – 1104 levels.
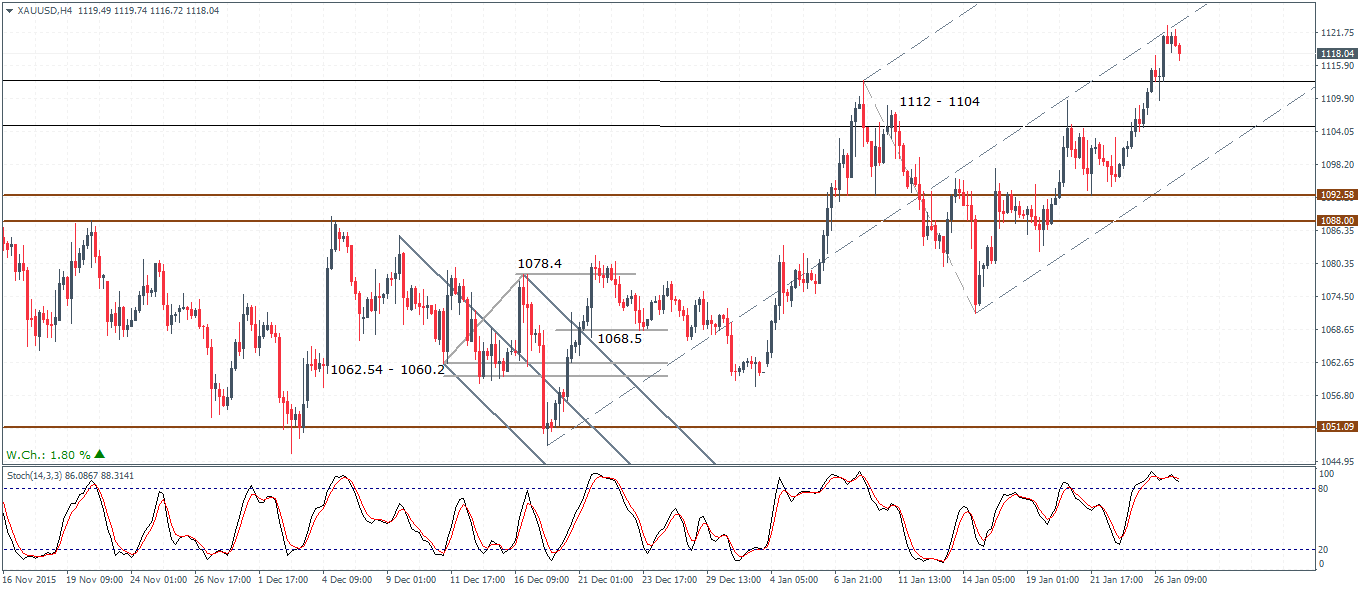
Finally, the H4 chart shows some interesting perspectives on the short term moves we can expect from Gold. 1112 – 1104 is the first level of defense which could see a short term bounce in prices. However, led by the FOMC catalyst, a break below this level will mark an eventual decline to 1092 – 1088 region. This could potentially establish a test of support at the previous resistance level for a move higher. To the downside, 1092 – 1088 will be key as a break below this level could trigger a move to 1078 – 1070 region and could potentially invalidate any bullish bias off the monthly chart.
In conclusion, Gold remains bullish on a test of support to 1092 – 1088 levels. We need to see a monthly close above 1088 in order to reaffirm the move to 1200 in the medium term horizon.
Silver – Technical Outlook
Silver prices are bullish this week but struggling to break the confluence of resistance near 14.37 marked by the horizontal resistance level and the median line. In the near term, we do not rule out a test back to the 13.82 level or higher but Silver could stay range bound within the 14.37 – 13.82 levels for the near term.
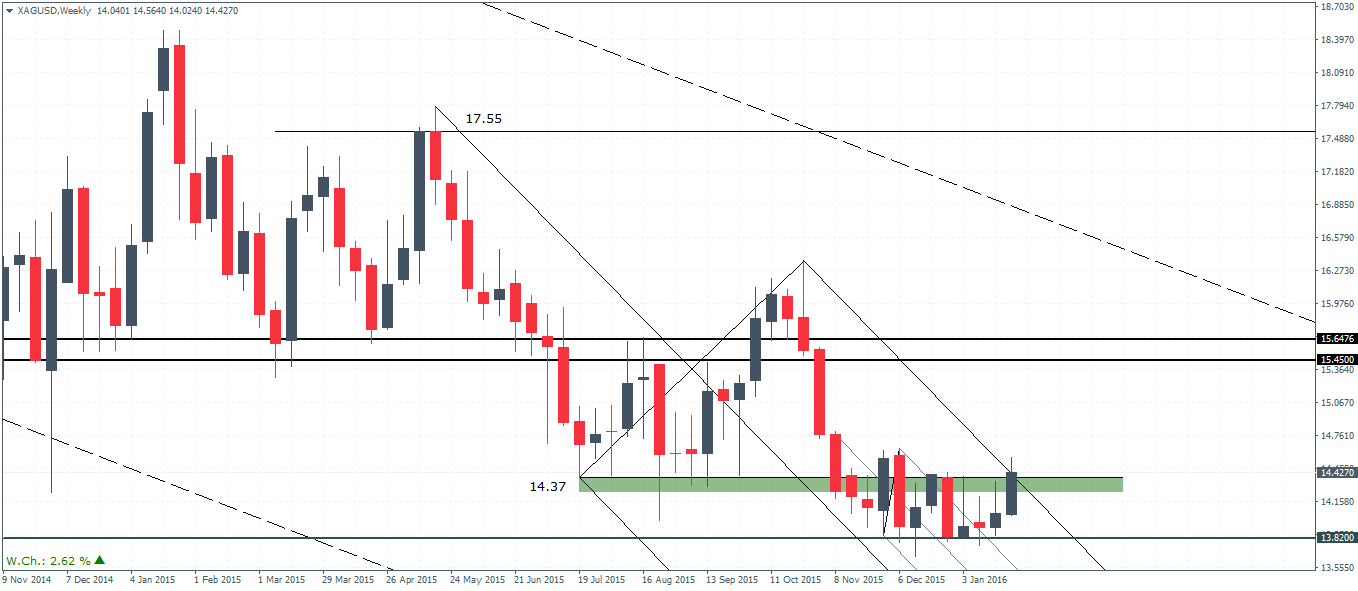
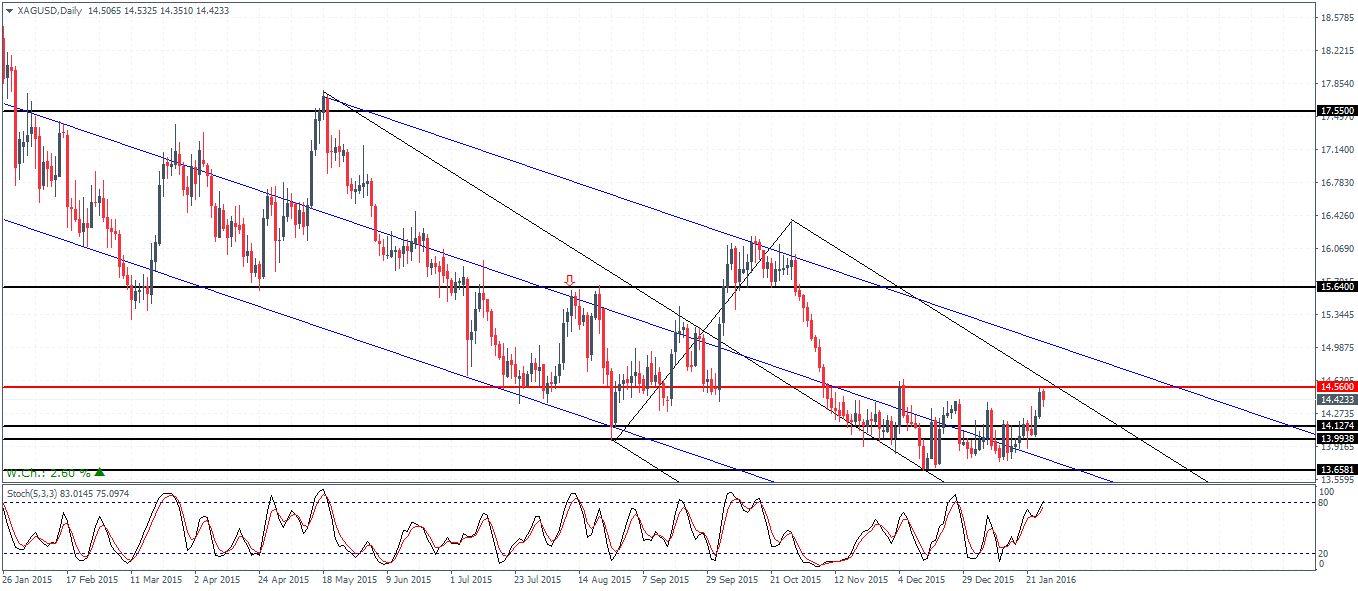
On the daily chart, Silver prices are currently looking to retreat off the 14.56 resistance which was previously identified. To the downside, 14.12 remains a key support level to watch for as prices could stay well supported. Of course, a break below the 14.12 – 13.99 support zone could see a test back to the previous lows near 13.64. However, the bias remains to the upside as long as Silver is trading at the 14.12 – 14 level.
In conclusion, Silver prices are expected to stay range bound in the short term between 14.37 and 13.82 price levels. The bias remains to the upside with the break above 14.37 opening the way for a larger test to 15.45 resistance.

