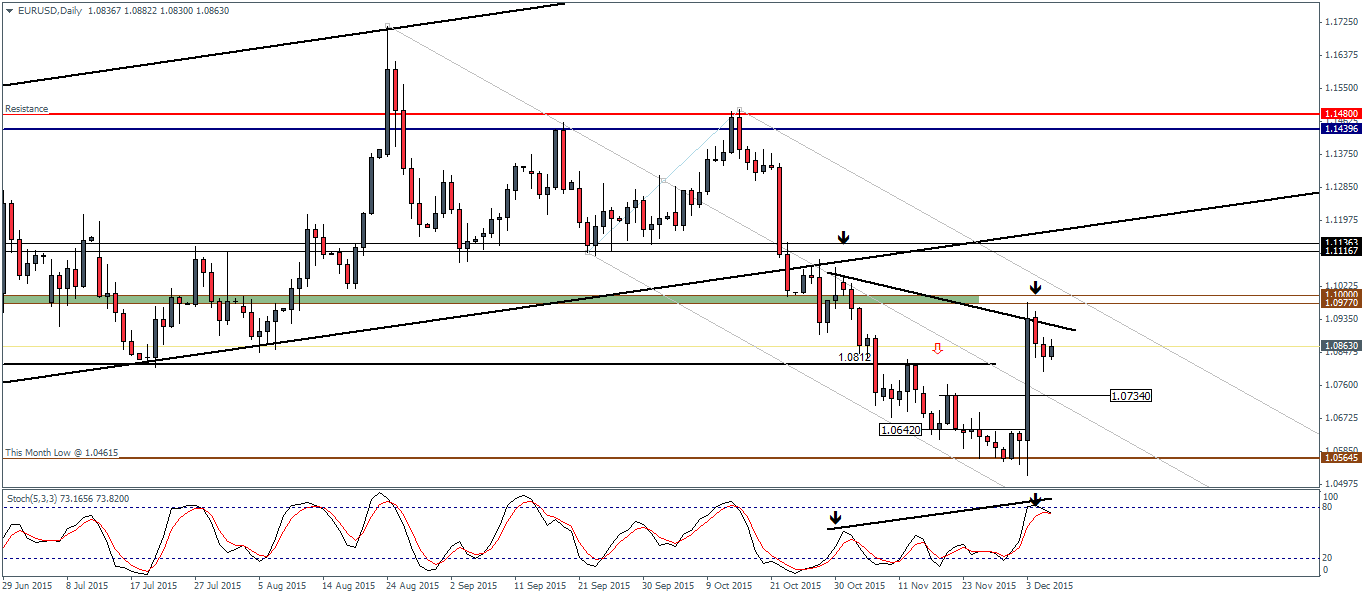
EURUSD (1.086): The strong reversal off the support near 1.0564 saw EURUSD rally to test the upper support now turned resistance at 1.10 – 1.0977. However, prices barely managed to test this level and we expect to see another minor leg higher to a more firm test of resistance at this level. It is likely to coincide with the outer median line as well with a possible timeframe of within the next 4 – 7 days. Establishing resistance at 1.10 – 1.0977 will then see a potential move lower to a test of 1.0812. Alternatively, ahead of a test of resistance, EURUSD could as well rollover to test the lower support at 1.0642 – 1.0724 ahead of a a rally towards 1.0977 – 1.10 resistance. There is also a hidden bearish divergence to the Stochastics being formed, which indicates a possible downside move ahead of a rally to 1.0977. Overall, EURUSD is likely to consolidate between these two levels in the run to the Fed’s December monetary policy meeting.
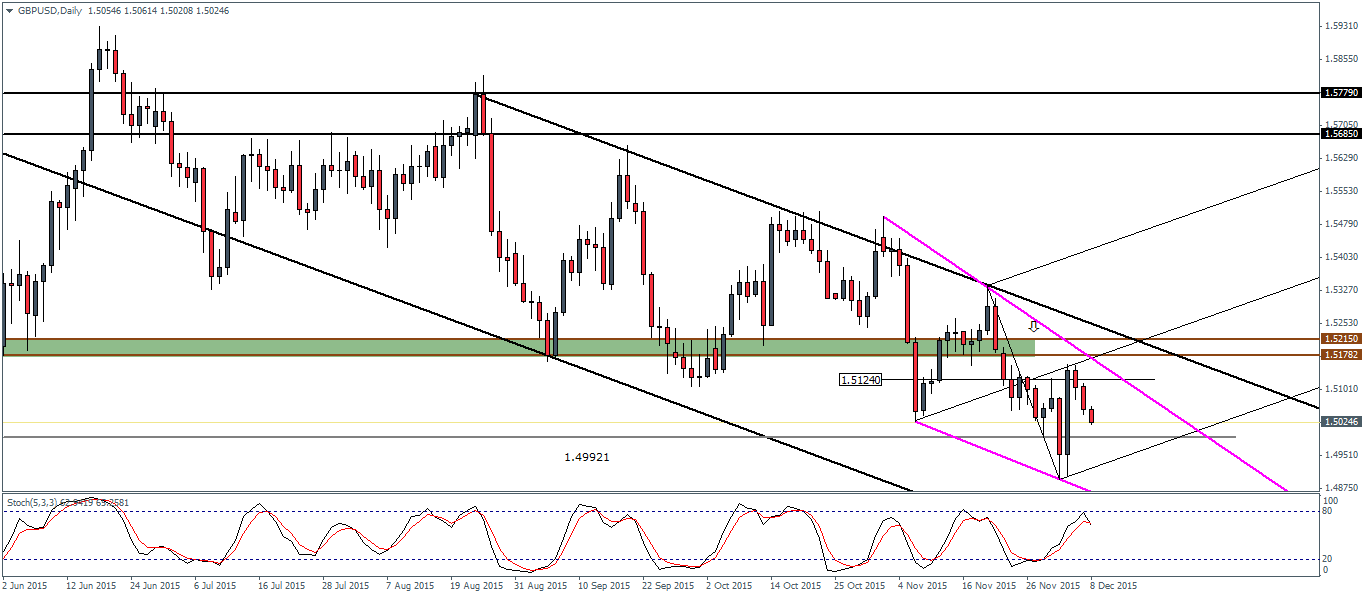
GBPUSD (1.502): Price failure at 1.5124 in GBPUSD has seen prices trending lower, now very likely to post a third consecutive decline. A retest to the support at 1.4992 looks to be a clear case and only a break below this support could hint further downside in GBPUSD. There is however a potential for another leg to the upside. Note the potential descending wedge pattern (Pink triangle) which could point to an imminent upside breakout. For this, GBPUSD will need to find support near 1.50 or 1.4992 level of support ahead of a rally higher. Resistance near 1.5178 – 1.52 looks to be the most likely target to the upside move. The upside bias will however be invalidated should prices break below the lower trend line of the descending wedge pattern. Note the Stochastics which are currently pointing lower but could form a bullish divergence which points to a correction towards 1.53 at the very least, an break above 1.52.

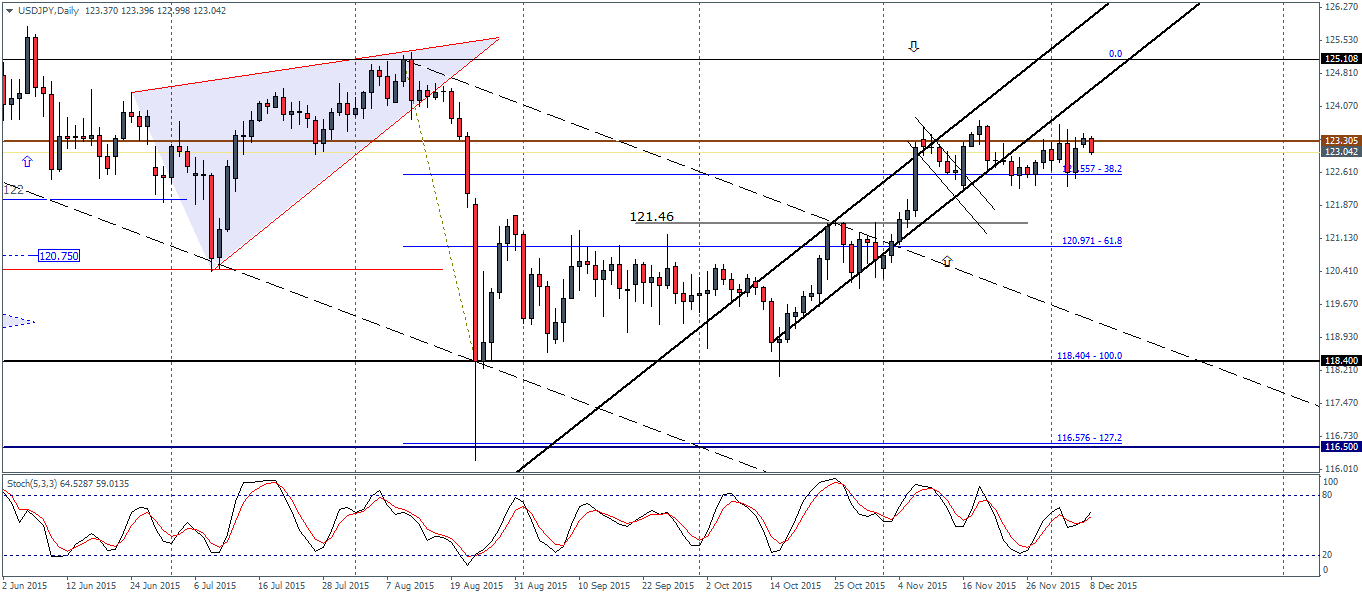
USDJPY (123.0): The multiple attempts to break above 123.3 resistance has made USDJPY trade sideways for the most part. The bull flag pattern is likely to be invalidated given the strong consolidation below 123.5 and the failure to break any higher. However, as long as prices are trading above 122.55, the sideways price action is likely to continue. The bias remains to the downside as the Stochastics continue to print a bearish divergence with lower highs while price has made higher highs. USDJPY could eventually correct itself to 121.46 through 120.97 region which marks the next immediate support. The longer term bias for USDJPY remains neutral as long as prices remain above 120.97 support. A break below 120.97 could see prices decline sharply to test 118.4 level of support.
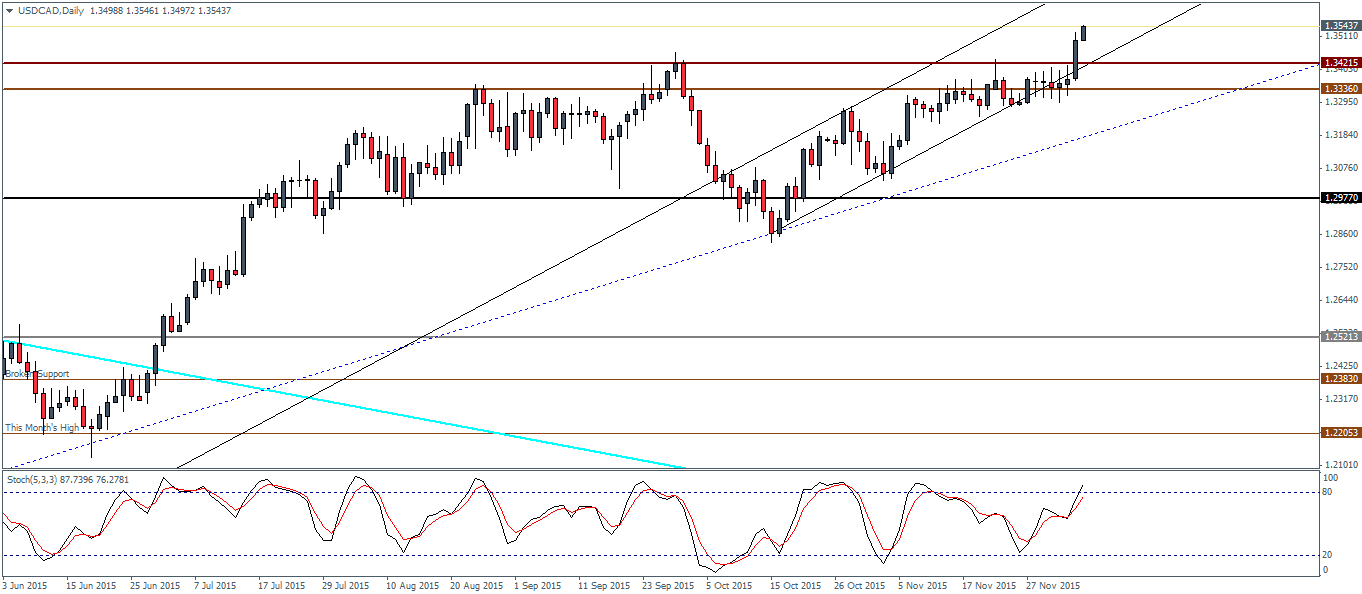
USDCAD (1.354): Prices have eventually broken above 1.336 – 1.3421 level of resistance and USDCAD is comfortably trading higher. Downside moves are likely to be limited to this support region. Note the rising price channel which looks steep while at the same time the Stochastics oscillator is printing a lower high. A possible bearish divergence here could see USDCAD possibly test the longer term trend line (dotted line) while a stronger correction could see USDCAD decline to as much as 1.297 following a minor bounce off the 1.30 psychological level.
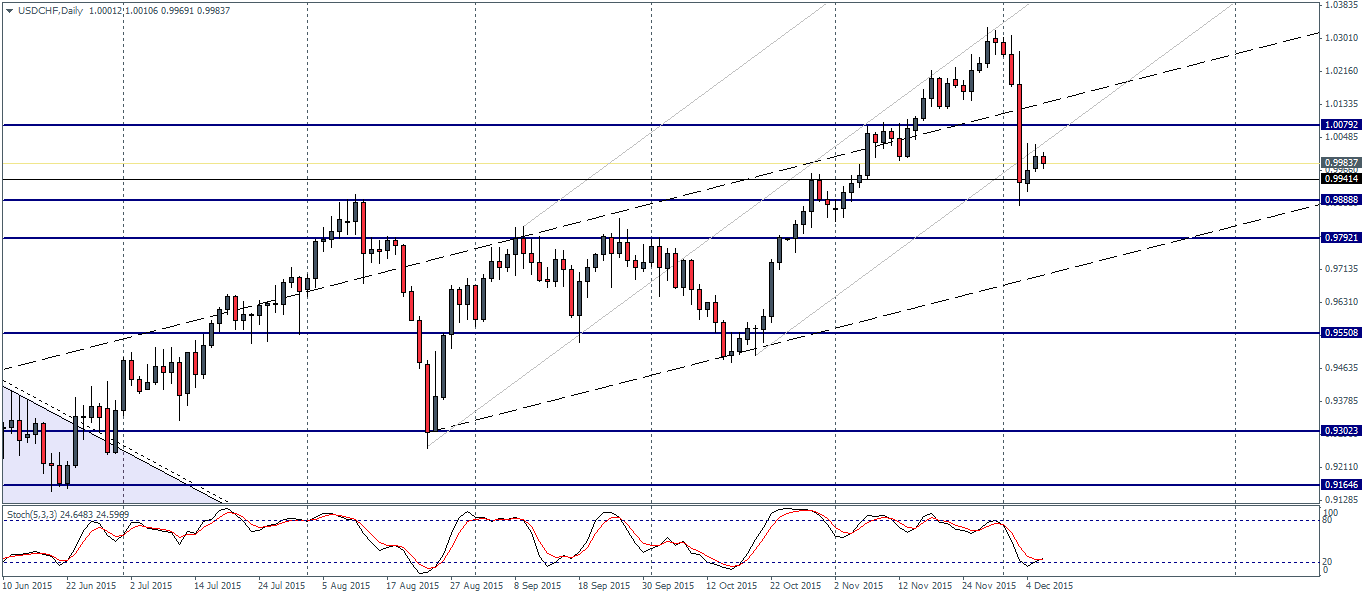
USDCHF (0.99): USDCHF failure at the median line saw prices rolling over strongly to test the outer/lower median line. Prices are currently looking to a retest of the support at 1.008. If resistance is established at this level, USDCHF could be looking at a firm test to 0.988 – 0.98 region of support zone. The upside bias remains weak for now in USDCHF and could be taken seriously only on a strong break above 1.008 level of support/resistance. Prices will also need to test this level to establish support ahead of a further move to the upside. For the near term, USDCHF is likely to range within 1.008 through 0.98 levels.