
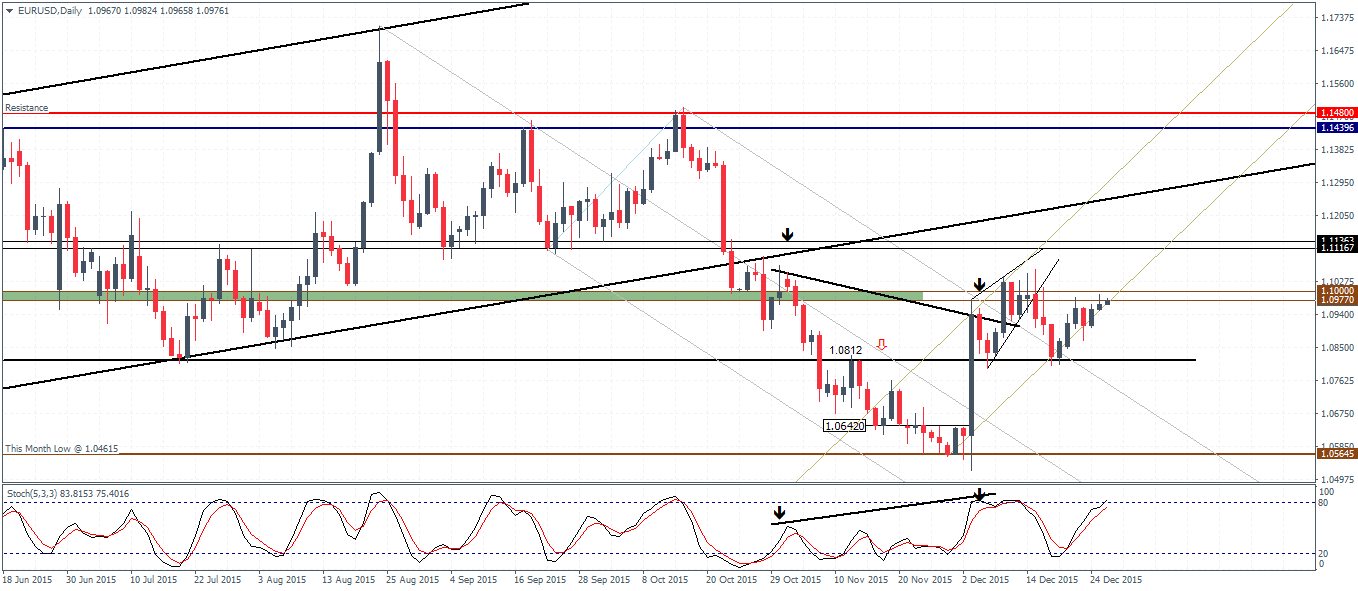
EURUSD (1.09): EURUSD has seen the last few sessions consolidating within 1.0812 – 1.10 price level. The breakdown from the rising wedge pattern has established a short term support at 1.0812, while the resistance at 1.10 remains a strong level that could cap the rallies, noted by how prices were strongly rejected above this level on previous occasions. However, in the unlikely event that EURUSD manages to close above 1.10 on a daily session, it opens up the price to test the next main resistance at 1.113 – 1.1116 region. Plotting the price channel connecting the lows of 30th November and 17th December, EURUSD has managed to find dynamic support off the lower trend line of the price channel. The downside risks are heavy as a break down from the rising price channel, along with the horizontal resistance at 1.10 could see another move lower to 1.0812 which if gives way could expose 1.0642 which is also the potential target on the head and shoulders pattern.
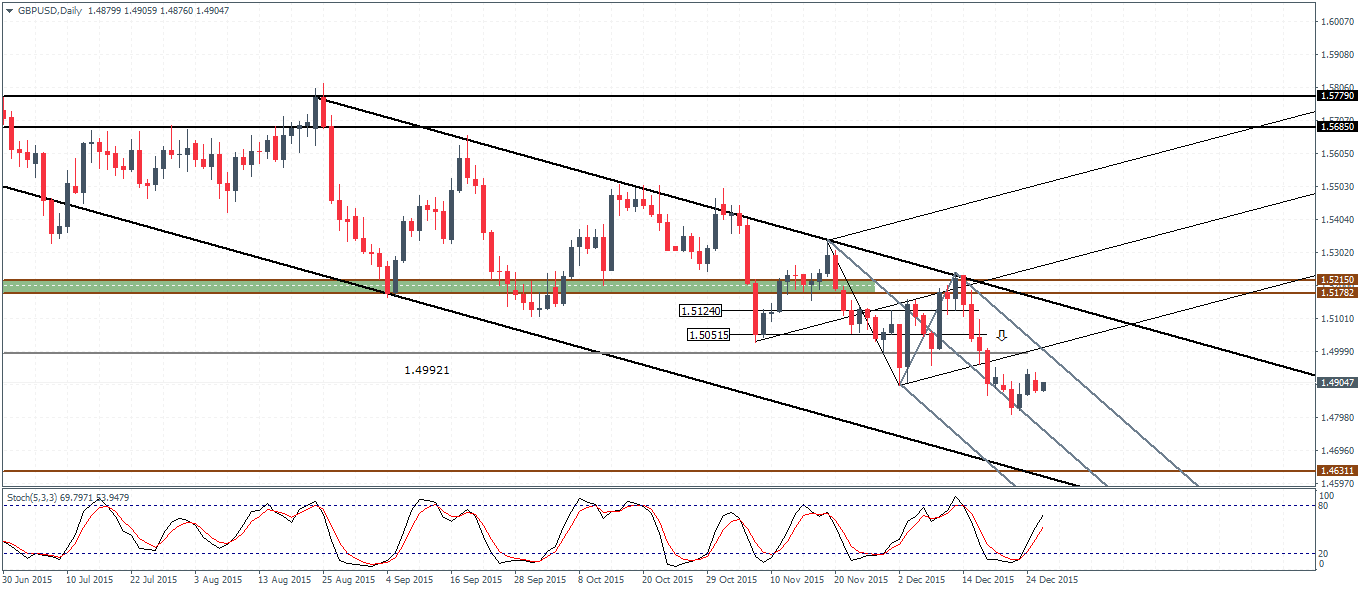
GBPUSD (1.49): GBPUSD has managed to find support off the median line and has managed to close near 1.493 before forming another inside bar. An upside breakout above 1.493 is required in order for price to push higher towards 1.4992 and a potential move towards 1.50 round number resistance. With prices trading outside of the main median line, the bias remains to the downside with 1.463 remaining as a key support level which could be tested in the medium term horizon. In the event of establishing support above 1.4992, there is a scope for a move towards 1.5124 level of minor resistance. Only a break above 1.505 will signal a possible shift of bias to the upside. For the moment, GBPUSD remains weak with 1.463 in sight.

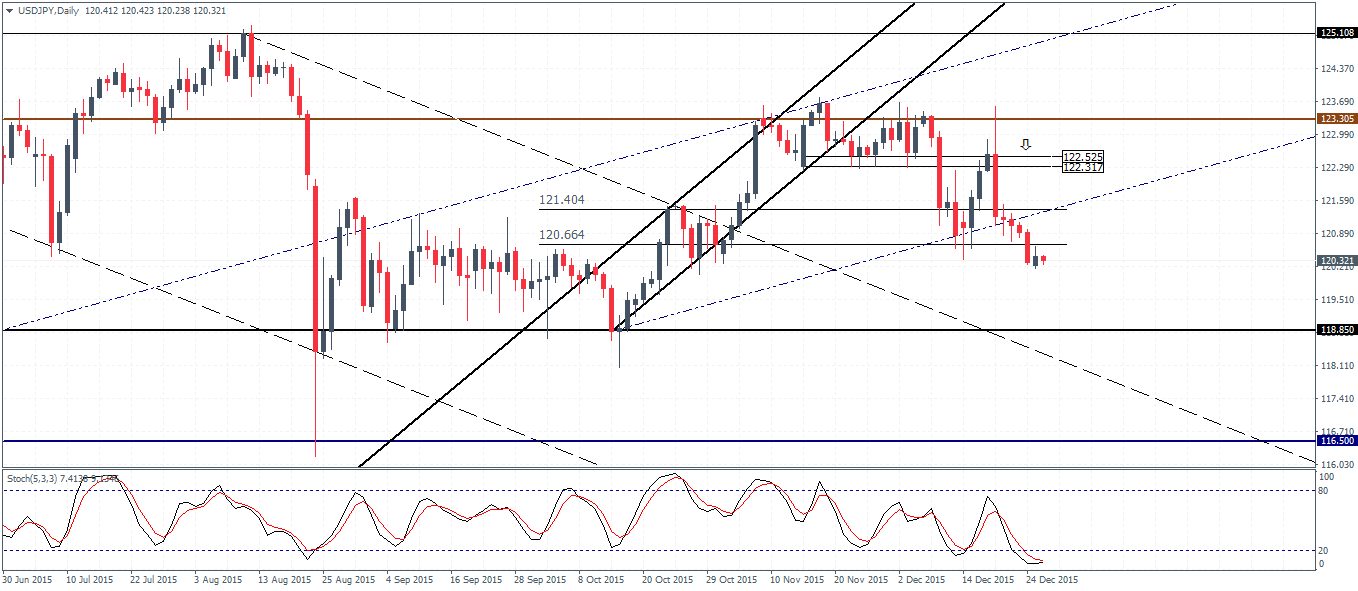
USDJPY (120.3): USDJPY has broken out from the rising price channel near 120.89. The Stochastics remains in oversold levels and could signal a short term correction back to 120.89 – 121.4 region. To the downside, USDJPY remains likely for a test to 118.85 – 118.4 level of support. The bias in USDJPY is to the downside, unless prices managed to move back into the rising price channel and establish support near the current resistance levels of 121.4 – 120.66 region.
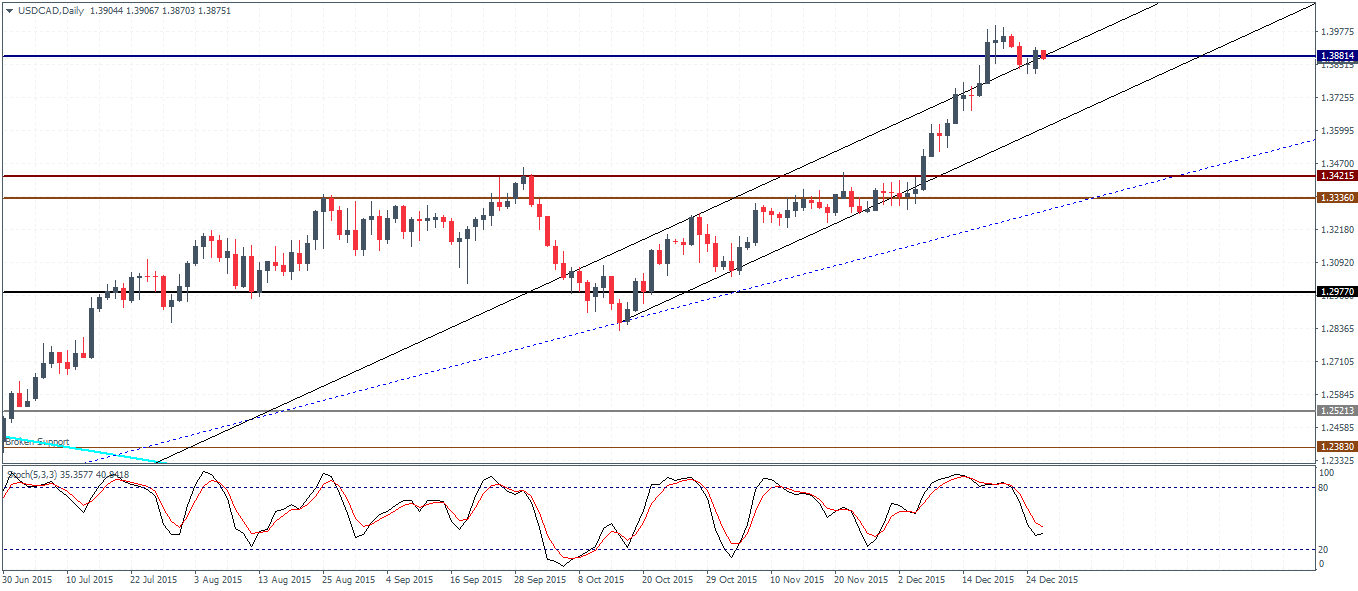
USDCAD (1.38): USDCAD formed a bullish close after a doji candlestick a day before near 1.388 level of support/resistance. A follow through is required with a higher close today in order for USDCAD to book new gains, failing which there is a strong risk of a move lower. The untested support at 1.3421 – 1.333 remains a key level of interest for the moment. The Stochastics oscillator is likely to see a possible move higher with a confirmation of a bearish divergence likely, which could signal a correction to 1.3421 – 1.333 region. USDCAD remains biased to the upside and any potential declines, especially to 1.3421 – 1.333 could be seen as strong levels that could attract new buyers into the market.
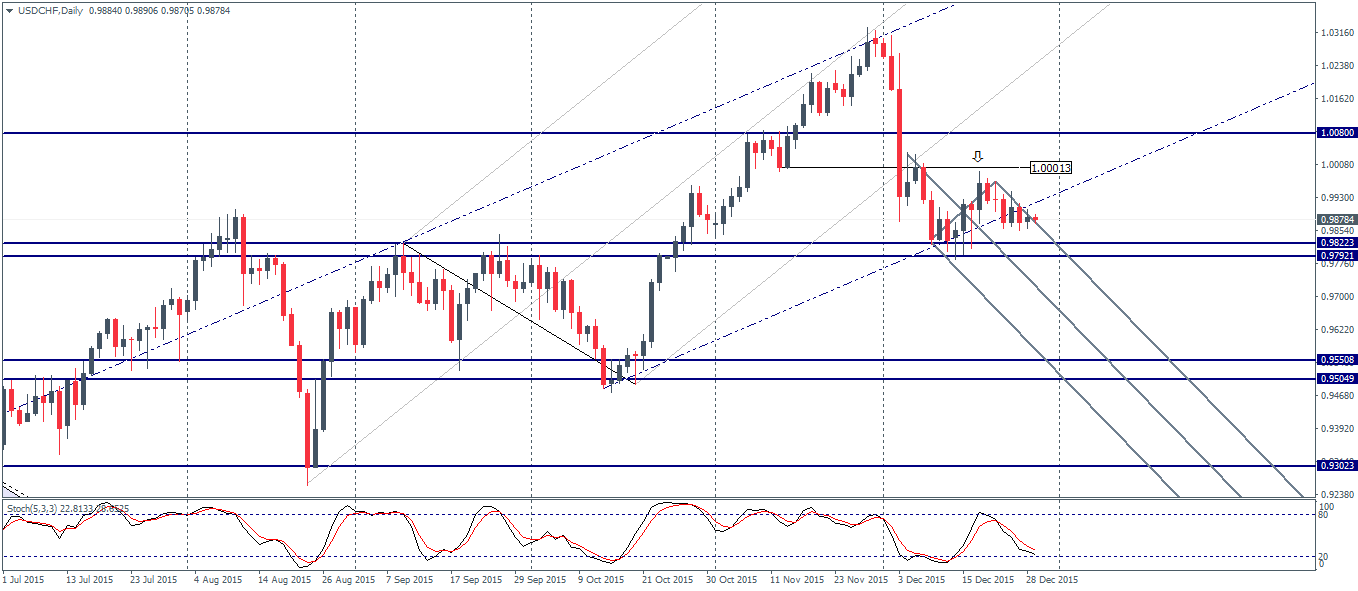
USDCHF (0.98): USDCHF has been consolidating within 0.982 and 1.0 price levels. With prices above 0.982 – 0.979, the bias remains to the upside with another leg higher towards 1.0 round number price level. However, the risks of the downside move are stronger with USDCHF breaking down from the rising price channel and in the event of a break below the support zone of 0.982 – 0.979, price action could see a strong move lower towards 0.955 – 0.95 support zone.

![Credit Card 160×600 [EN]](https://assets.iorbex.com/blog/wp-content/uploads/2023/06/13144507/Blog-Banner_EN-Banner_160X600X2.webp)