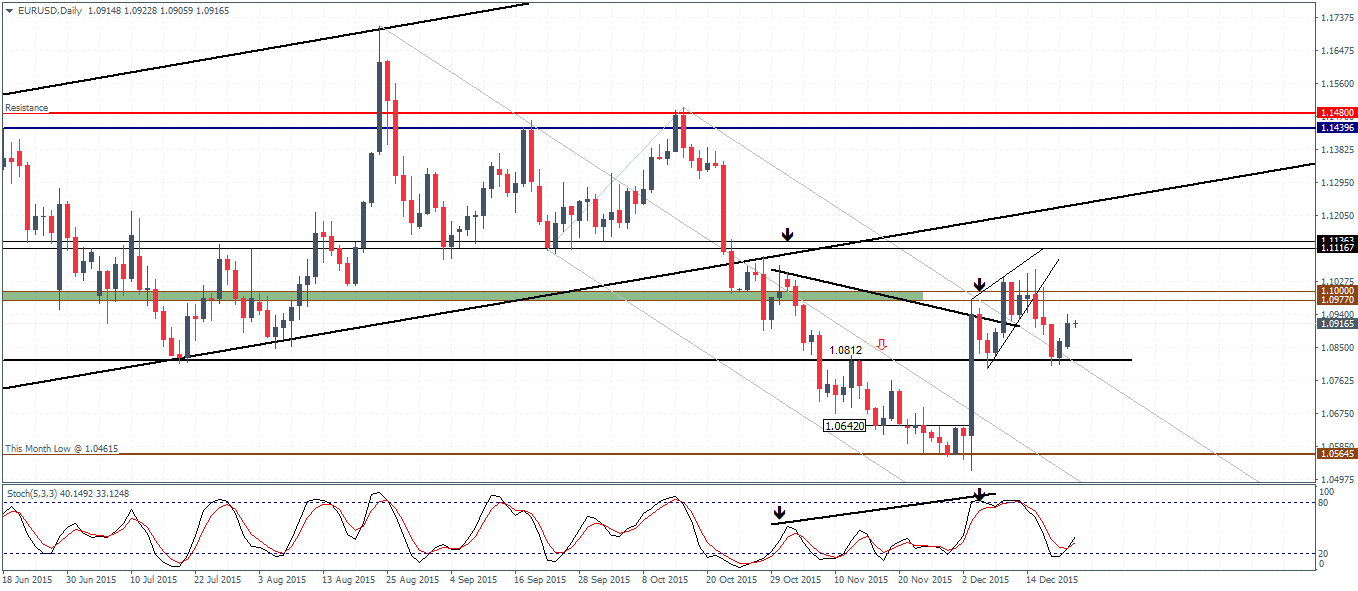
EURUSD (1.09): EURUSD remains bearish below the resistance of 1.1 – 1.0977. Failure to post a convincing close above this resistance level has seen prices consolidate into a rising wedge followed by a breakout to the downside. EURUSD’s declines of the rising wedge pattern saw price test support near 1.0812 which offered a minor bounce which could see a retest to 1.093 region. With the hidden bearish divergence established on the charts, EURUSD could be looking to test the lower support near 1.0642 – 1.065 region if the lower support at 1.0812 gives way. Price could remain range bound above 1.065 and below 1.0812 for the near term. However, the Stochastics is likely to plot another higher low on price which could see an eventual test to 1.113 – 1.111 region in the medium term on a test of support near 1.065.
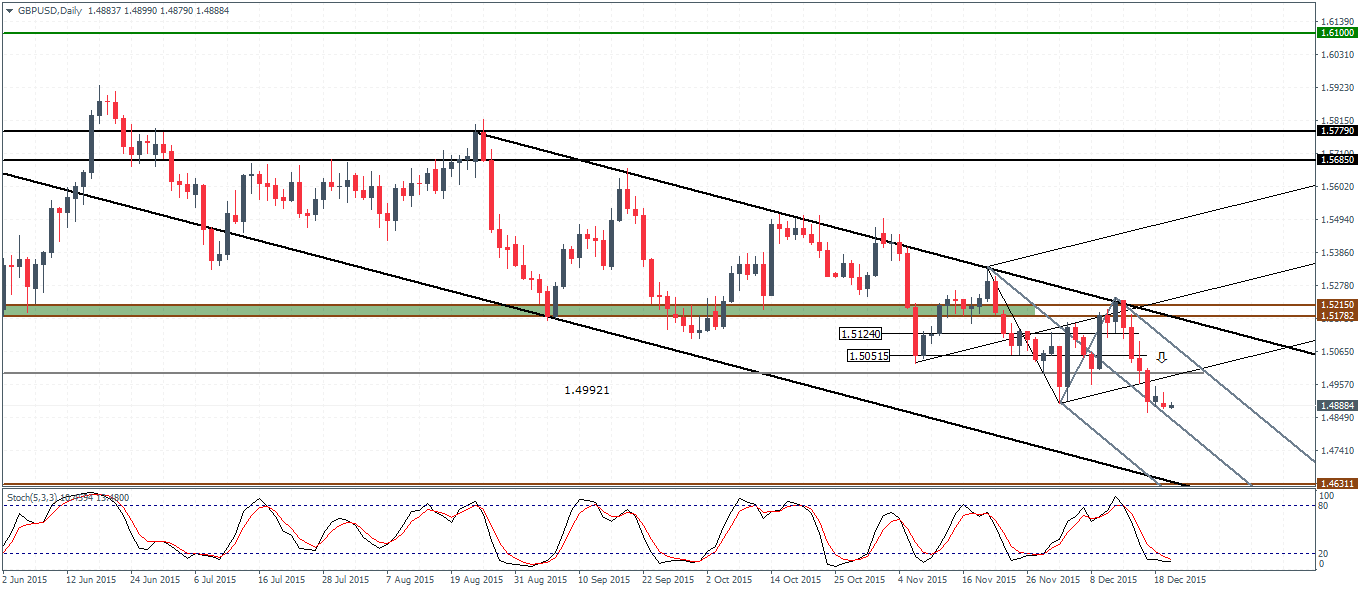
GBPUSD (1.48): GBPUSD has broken down below 1.4992, which we had anticipated in the previous weekly analysis. The breakdown of prices from the Median line could see a retest to 1.505 region in the near term, but the bounce is likely to be short-lived. Plotting the new Median line (thick), prices are near the median line at the moment which could see a short term move towards 1.499 – 1.50 to test the outer median line, which shows a confluence of both the horizontal resistance level and the median line that could cap the rally. To the downside, the support near 1.4631 remains a very likely possibility. In the medium term outlook, GBPUSD remains biased to the downside with price ranging gradually in the larger falling price channel and the newly plotted median line.

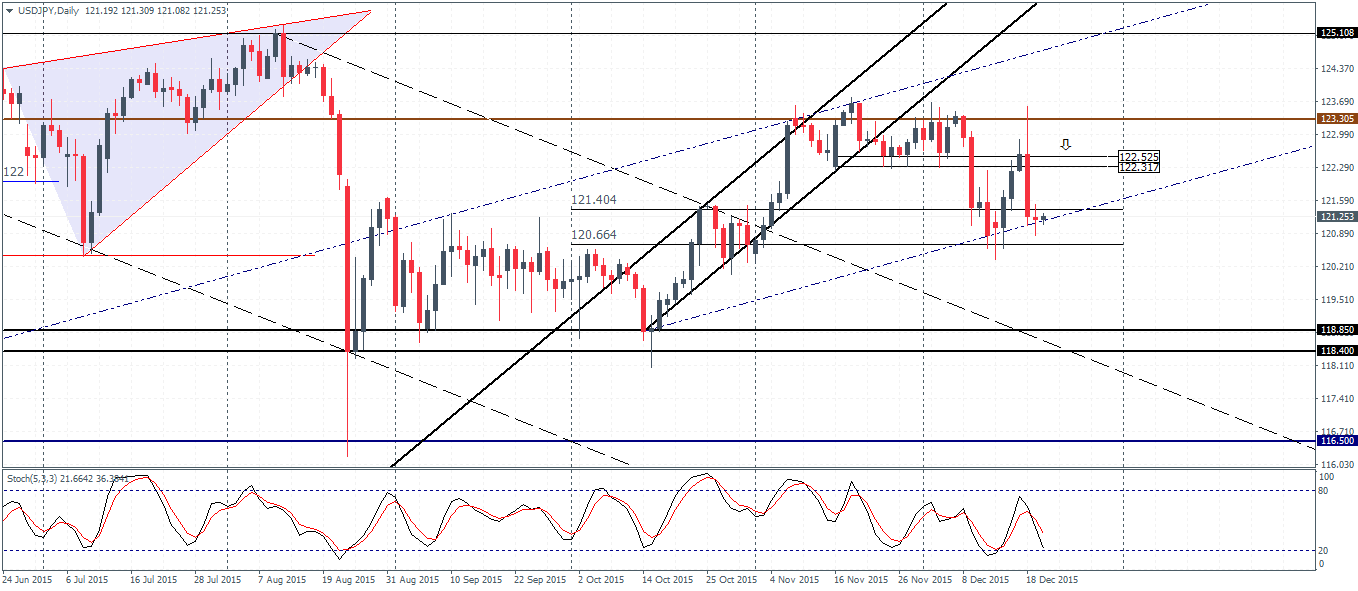
USDJPY (121.2): USDJPY is back to moving in a range, this time within 123.3 and 120.67 region. With yesterday’s candlestick pattern forming a Doji, a close above yesterday’s high of 121.507 could see a move back to the support/resistance at 122.317 – 122.525. Only a close above this level will establish further moves to the upside on the break of 123.3 resistance which has been tested multiple times over the past 5 months. As such, USDJPY remains biased to the downside if 122.525 – 122.317 resistance holds with a possibility to dip down to 118.85 – 118.4 level of old support. A breakdown below this support will open the way for a test to 116.5. The newly plotted rising price channel shows a dynamic support being built off the lower trend line of the price channel and confirms the view of a downside bias as long as USDJPY is trading below 123.305.
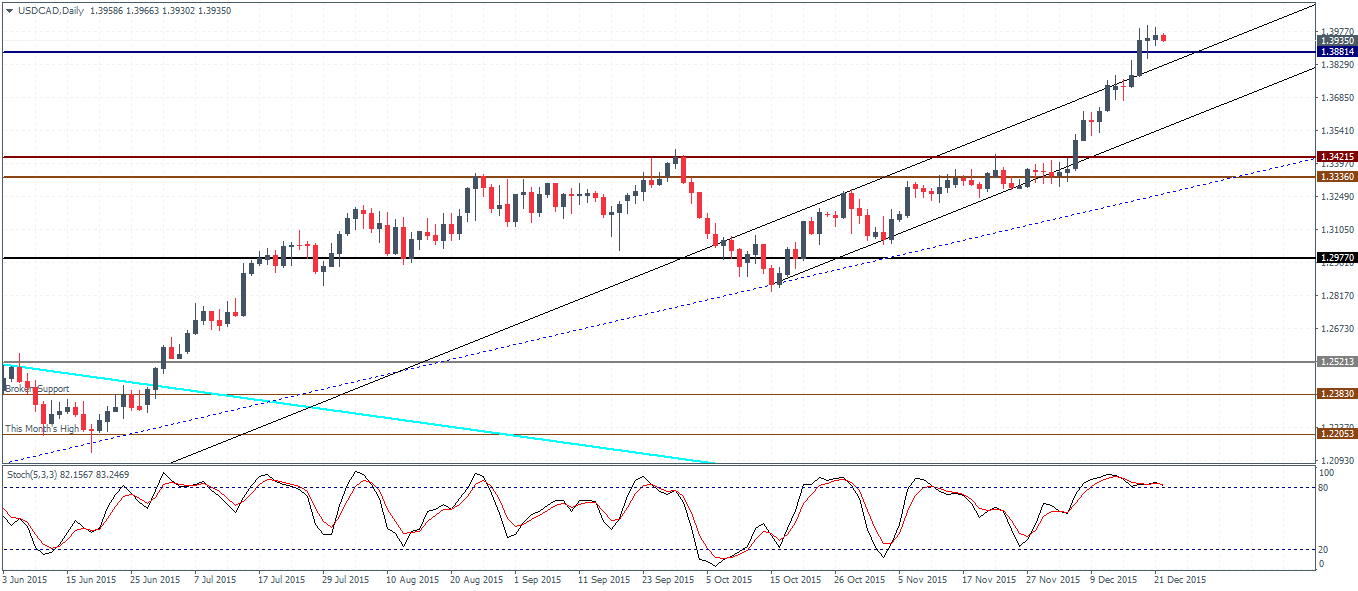
USDCAD (1.39): USDCAD has broken out to post new multi-year highs over the last week. However, prices have formed a series of spinning top candlesticks near 1.397 region which shows a possible exhaustion to the uptrend. The short-term support near 1.3881 remains a key level to watch as a break below this support could see prices bounce back to establish resistance. In such a scenario, USDCAD could dip down to the previous resistance level at 1.3421 – 1.3336 level in order to establish support. The medium term bias in USDCAD remains to the upside and only a break below 1.3336 support will change the view for a decline lower to 1.2977.
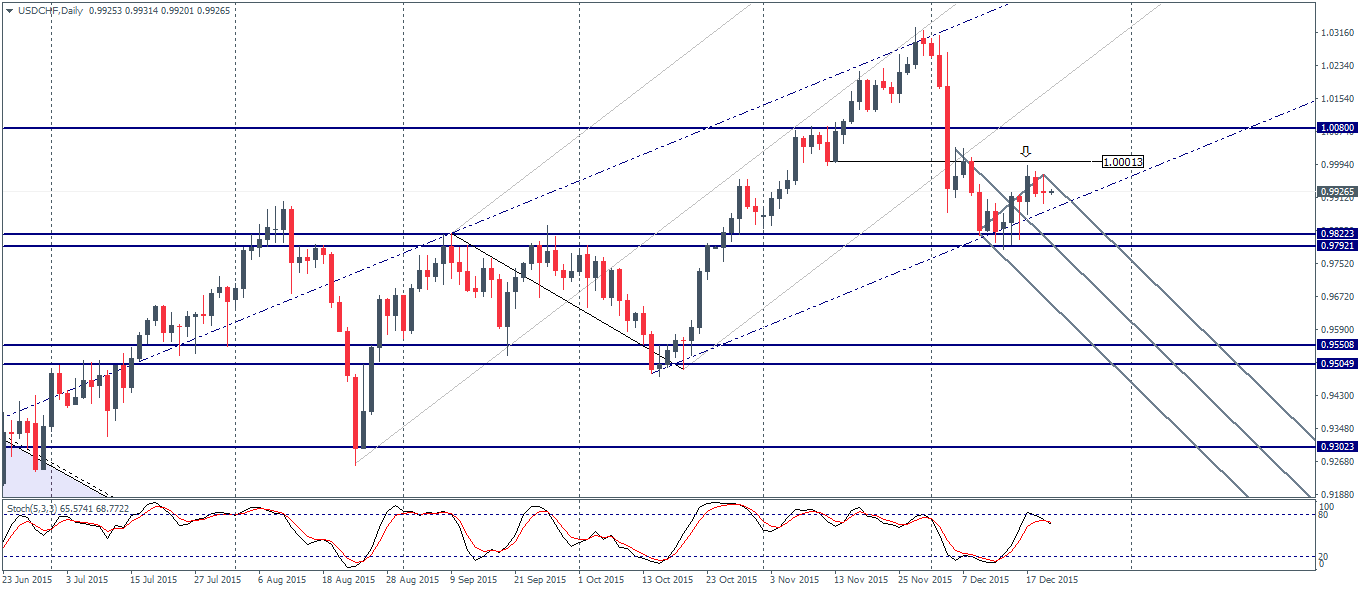
USDCHF (0.99): USDCHF has found support near 0.9822 – 0.9792 region. With yesterday’s price action closing in a doji, a close above yesterday’s high of 0.9968 is needed for a move to the upside which could see a possible break above 1.00792 level. The falling median line will be key as a breakout to the upside could signal further continuation to the upside but there is a scope for a test back to 0.9822 – 0.979 support level before moving higher. Below 0.9822 support, the next main support comes in at 0.955 – 0.9505 level while a close above 1.008 could see prices attempt to test previous highs.