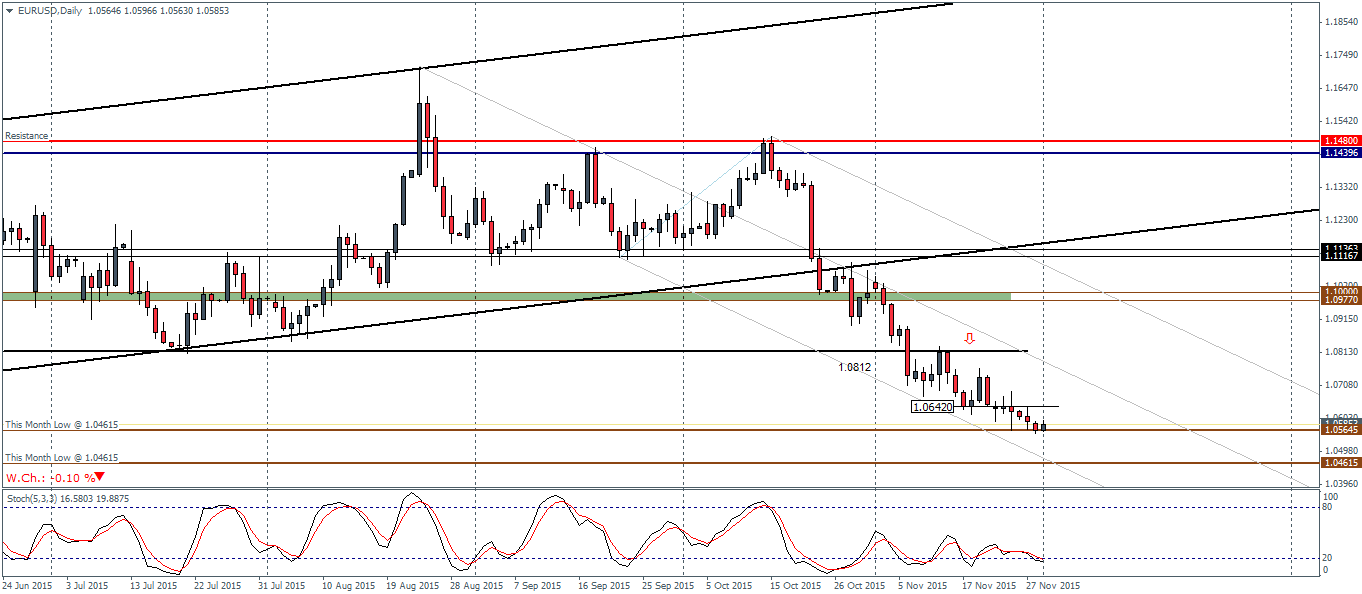
EURUSD (1.059): EURUSD continues to trend lower with no reasonable correction in sight. However, the Stochastics continues to build up a strong bullish divergence, which taken into context brings the risk of a short squeeze on the Euro in the near term ahead of the ECB’s meeting this Thursday. The Stochastics divergence points to a possible correction to 1.0812 which could be confirmed if prices manage to form a base above 1.0642, which marks the most recent low prior to the modest pullback. With prices currently trading at a previously recognized support zone near 1.05645, the bias for a bullish correction starts to look more and more likely. Alternatively, if prices continue to move lower, a break below 1.05645 could see a test to the lower support at 1.04615.
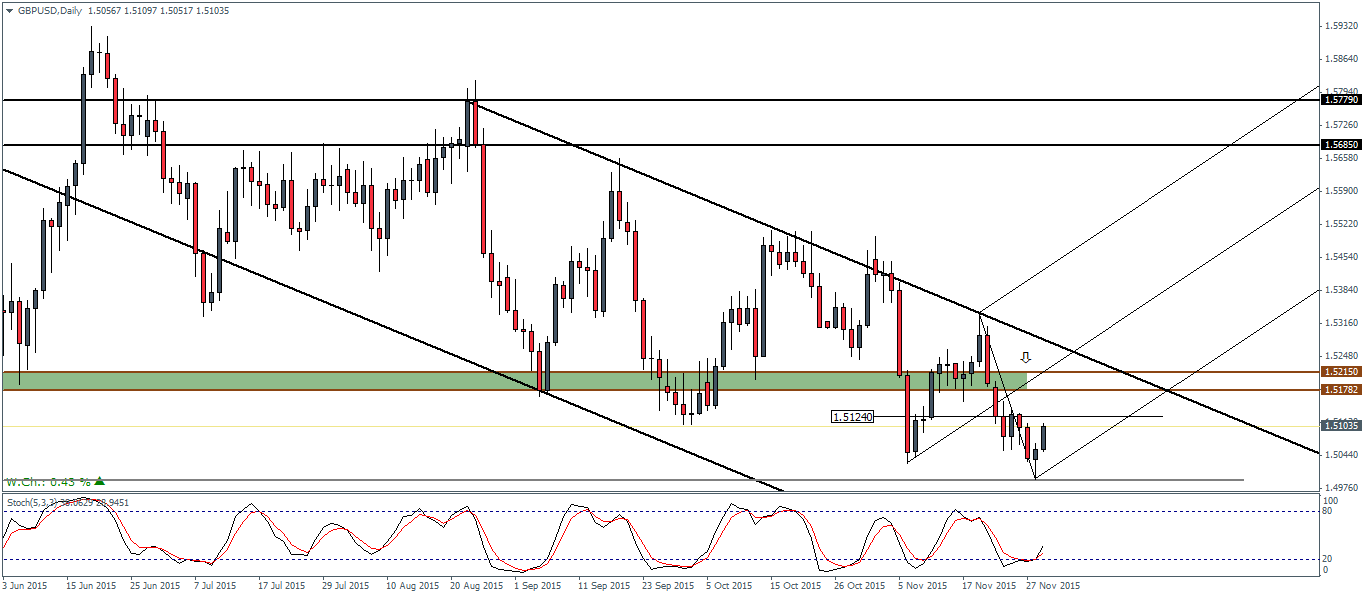
GBPUSD (1.509): After breaking below the main support/resistance price zone at 1.5215 – 1.5178, GBPUSD is attempting another go to test the resistance zone. Plotting the median line, we expect to see a correction that could possibly fail at the resistance zone around 1.5178 if prices manage to close above the recent minor high of 1.5124. Price failure at 1.5124 could however shift the bias to the downside which will see GBPUSD breaking strongly below the 1.50 psychological price level. However, with the most recent price action resulting in a strong reversal pattern, a test to 1.5178 cannot be ruled out. While the bias remains to the downside, GBPUSD looks more appropriate for a new bearish leg taking place around 1.5178 – 1.5215.

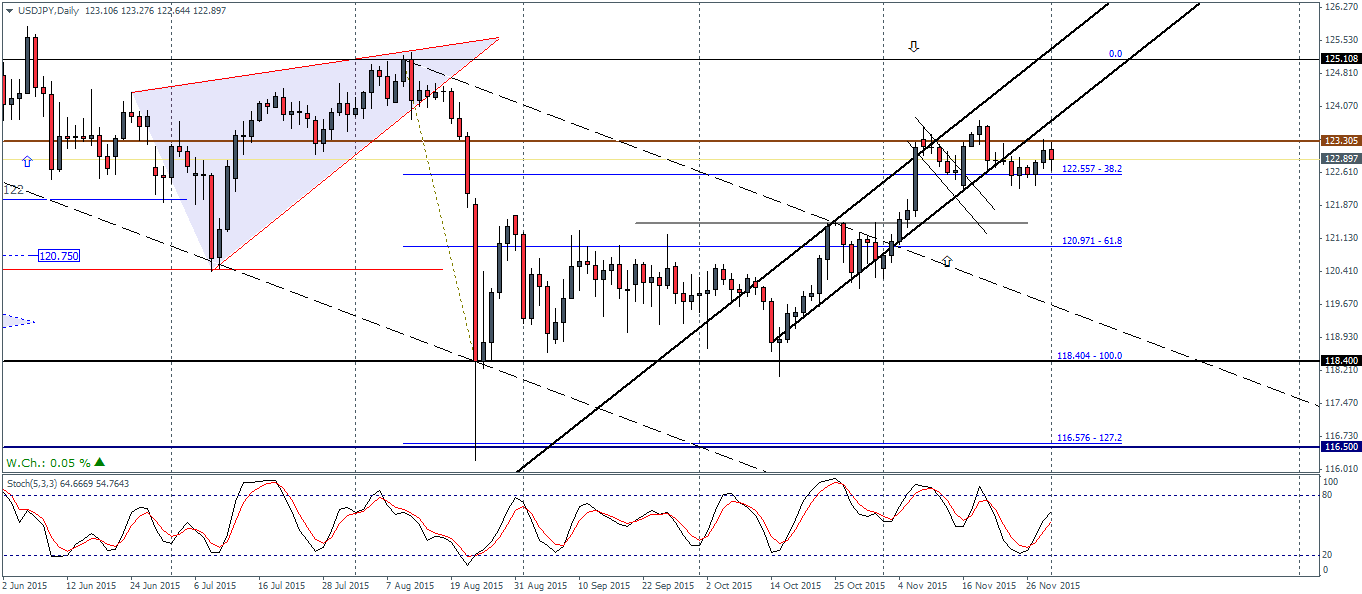
USDJPY (122.92): USDJPY is starting to look more convincing that the bull flag is likely to fail with prices reversing strongly near 123.3 level of resistance. However, with support being established at 122.55 only a break below this support will confirm the bearish view. There is also a potential head and shoulders pattern being formed on the USDJPY daily chart, which points to a move lower near 121.5 at the very least. The daily candlesticks from here on will be key as failure to close above 123.3 could confirm an imminent decline lower. The downside view could however be invalidated if prices manage to post a new high above 123.6.
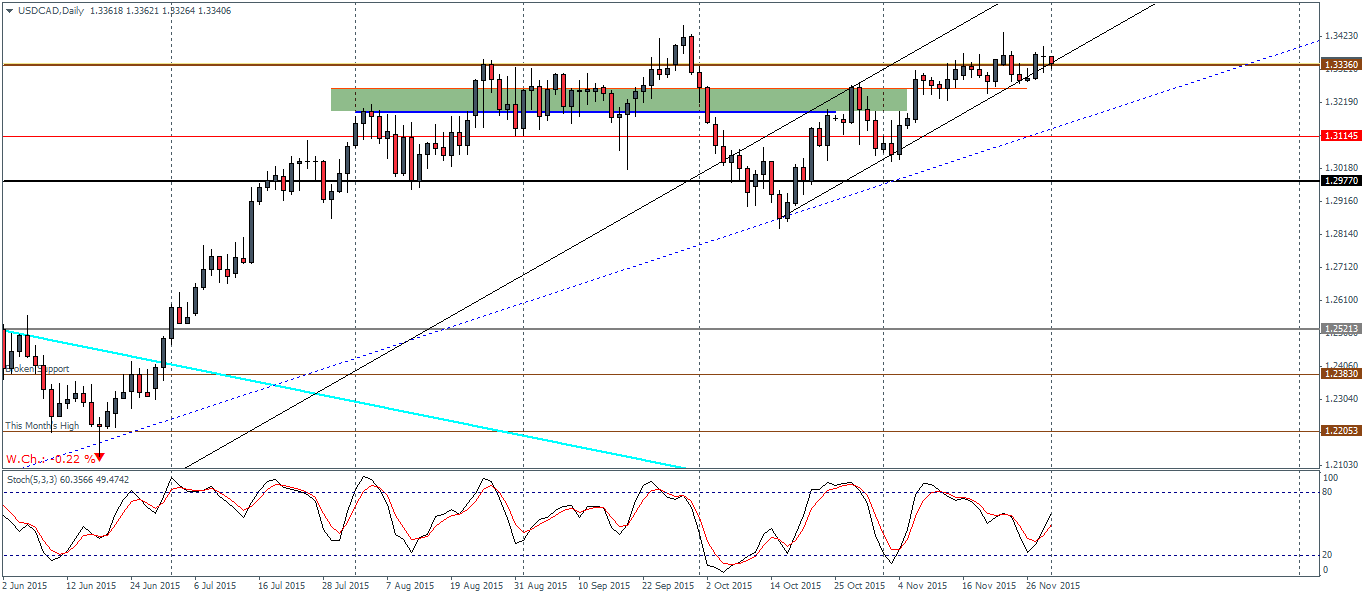
USDCAD (1.334): The daily chart for USDCAD shows a bearish reversal pattern near 1.3336 resistance level. Yesterday’s doji marked indecision but a bearish close today below the doji’s low at 1.3312 will confirm a move lower. Support comes in at 1.3115 – 1.308 region. The break down will also see prices falling out from the rising price channel confirming this view. The Stochastics oscillator is pointing to a bearish divergence, which will see an initial test of support at 1.3262 failing which a move lower could be anticipated. Alternatively, the bullish view remains neutral as of now until we see some strong bullish candlesticks above the doji’s high.
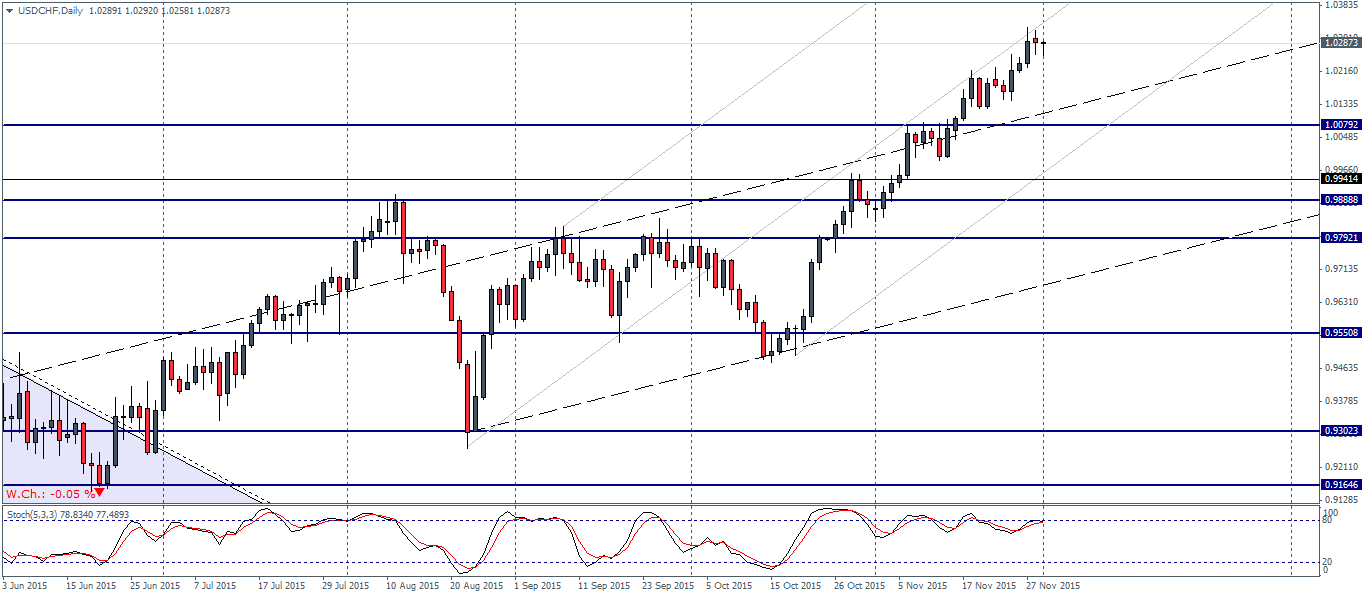
USDCHF (1.029): USDCHF closed yesterday with a spinning top pattern and points to a downside move in the near term. This is further validated by the median line failure with prices being rejected near this dynamic resistance multiple times. A move lower could see support being established at 1.008 region which shows confluence of the previous resistance and the dynamic resistance coming off the rising price channel from which USDCHF broke out strongly to the upside. There is also the Stochastics divergence which points to an imminent correction to 0.9945 if 1.008 fails to support prices. A strong bearish confirmation near the current highs is be required to confirm the bearish corrective view on USDCHF.