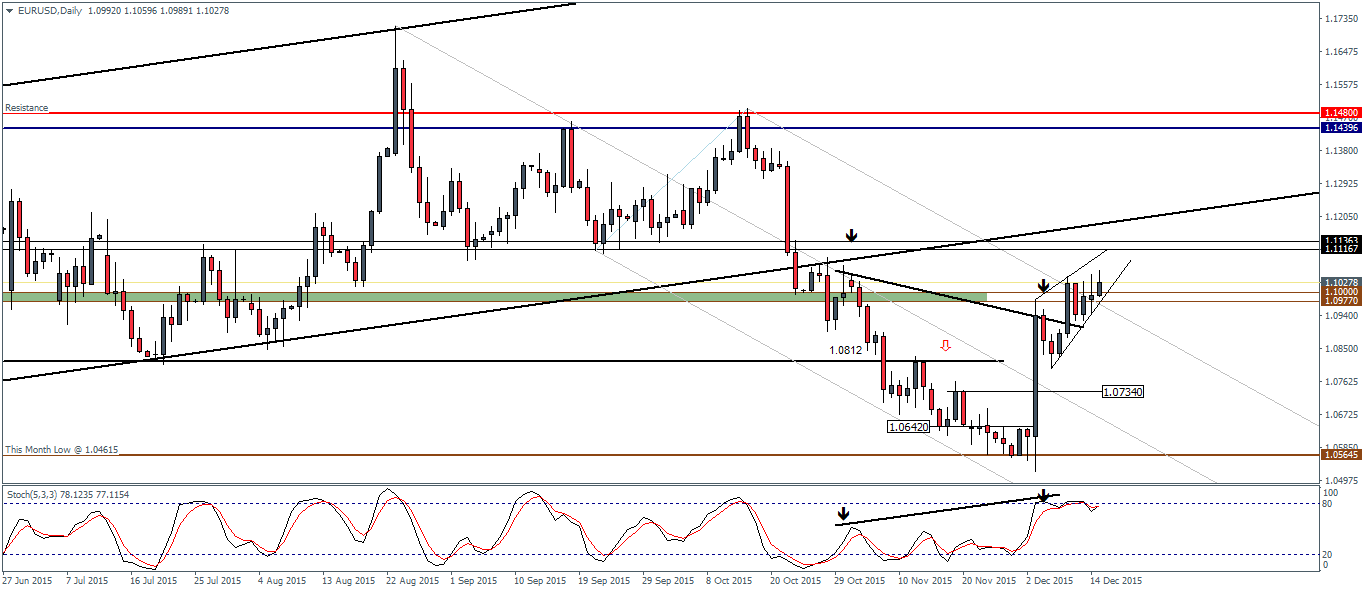
EURUSD (1.102): EURUSD has been consolidating near 1.10 – 1.097 level of resistance for the past five sessions on the daily chart. The preceding rally off the lower median line failure near 1.0564 has seen prices rally straight up to the outer median line which has a confluence with the horizontal resistance level. The consolidation at this resistance has turned into a rising wedge pattern, which, combined with the hidden bearish divergence to the Stochastics points to a possible correction lower.
Support at 1.0812 remains of immediate interest and a break below this support could expose the lower levels near 1.0734 – 1.0642. Because prices have rallied strongly and with no retest to the median line, there is a bias for EURUSD to decline back to 1.0734 at the minimum. Alternatively, with prices above the support level of 1.10 – 1.0977, there is scope for a further rally to test 1.113 – 1.1116 region of previous support which could be tested for resistance.
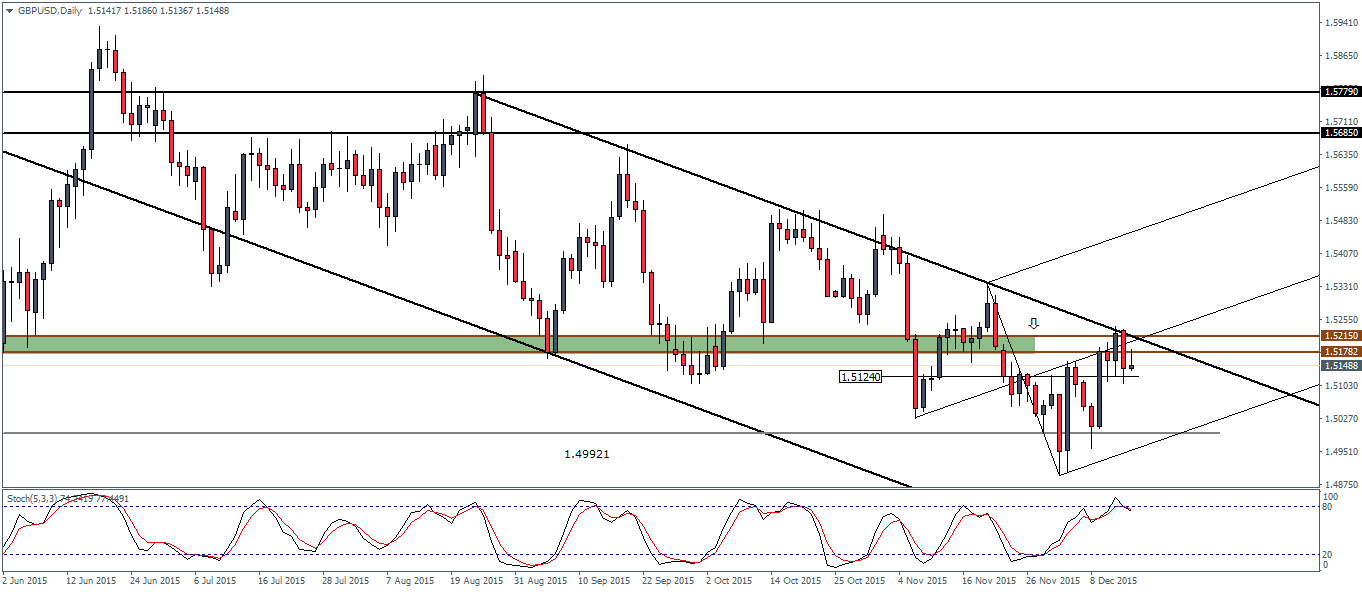
GBPUSD (1.514): GBPUSD has failed near the support/resistance level of 1.5215 – 1.5178 region. Yesterday’s daily session closed in a strong bearish engulfing pattern, which could indicate a move to the downside. Price is, however, likely to find near-term support near 1.5124, but a breakdown could see a test back to 1.4992 and below the 2nd December lower close at 1.495. The Median line failure also indicates the move lower with a pending retest to the lower median line. Therefore, GBPUSD remains biased to the downside to 1.4992 to as low as 1.495.

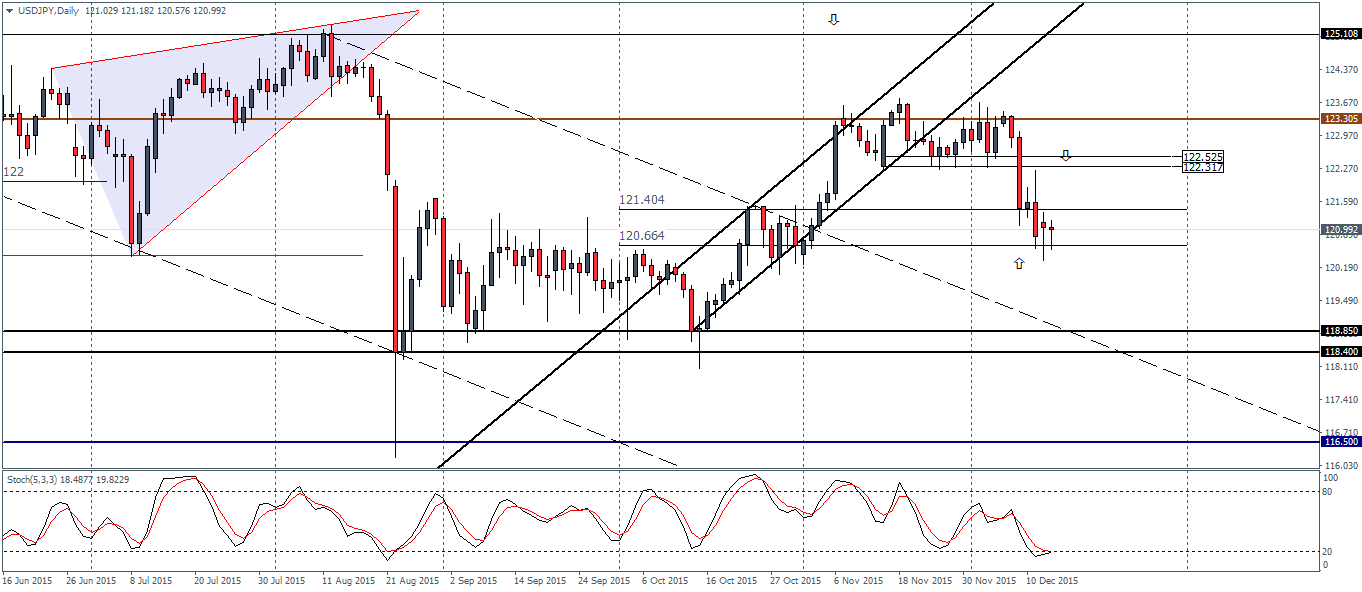
USDJPY (120.95): USDJPY’s declines have fallen to the lower support at 121.404 – 120.664 and the consolidation off these levels indicate a near-term bounce back to 122.525 – 122.317 region of resistance which has held previously. In the event that USDJPY breaks below 120.664, the support is likely to give way to steeper declines down to 118.40 – 118.85 support. The decline to this support also shows confluence with the upper trend line of the larger falling price channel. With the FOMC rate decision looming, USDJPY could be eventually looking towards an ultimate test down to the 118.85 – 118.4 support.
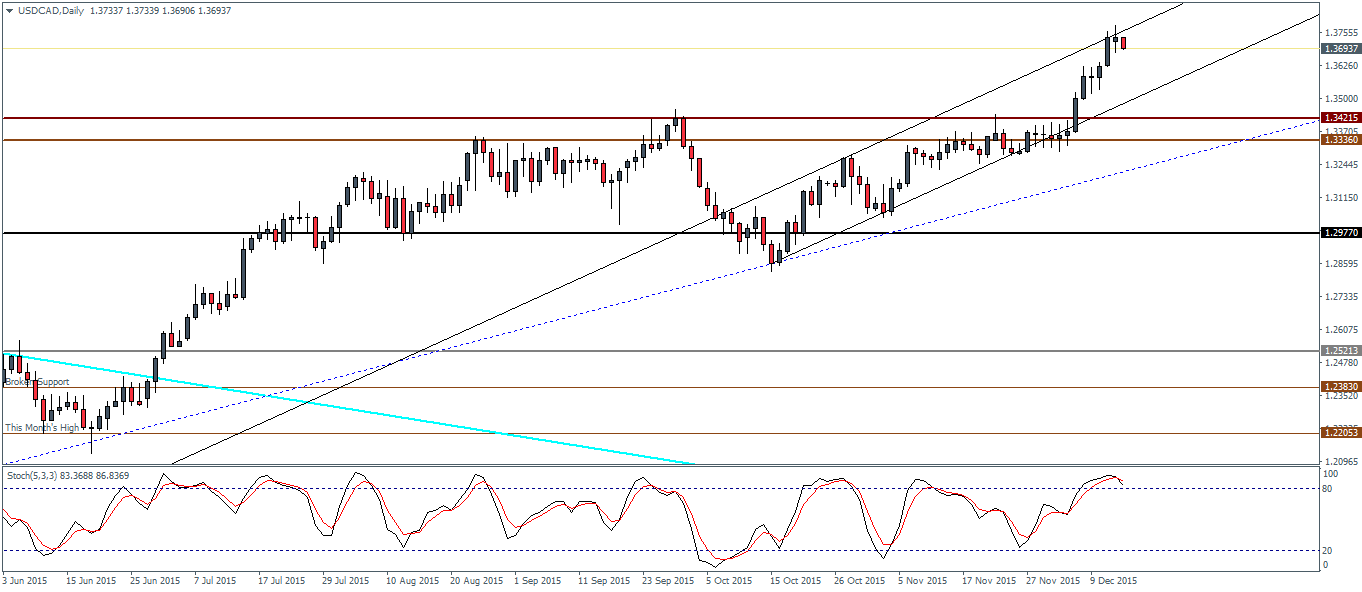
USDCAD (1.369): USDCAD’s strong rally off the resistance near 1.3421 – 1.3336 has seen prices test new multi-year highs. However, yesterday’s spinning top pattern indicates a near-term exhaustion and further rallies will only be validated on establishing support at the broken resistance level. The downside in USDCAD is very limited where, an unlikely break below the support/resistance level of 1.3421 – 1.3336 could see a dynamic support of the longer term trend line with a scope of falling down to 1.2977 support.
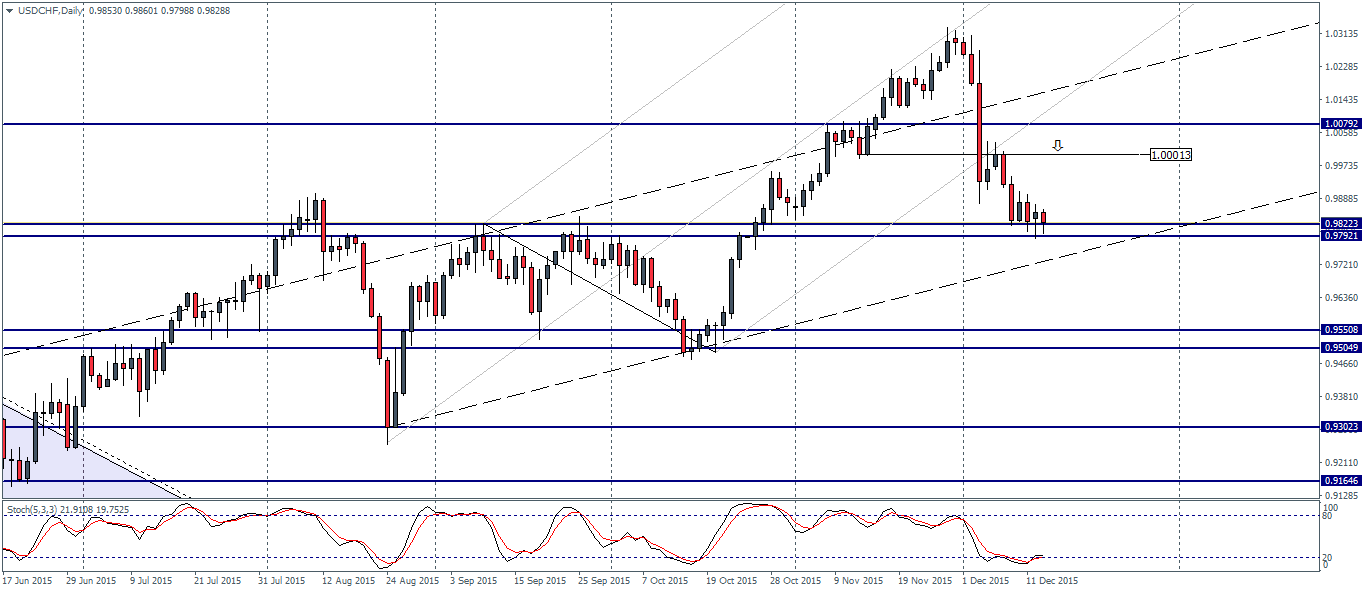
USDCHF (0.98): USDCHF’s sharp decline off the highs near 1.031 has seen prices break down to test the previous support/resistance level at 0.9822 – 0.9792 region. There is a scope for a near-term bounce to retest the median line breakout which could be near 1.00013 breakout level. To the downside, the rising price channel is likely to offer dynamic support. Failure near 1.00 region in USDCHF could potentially make the current support vulnerable with an eventual decline to 0.955 – 0.95.