US Dollar Index fails to break above 100, expect a test of support lower
The US Dollar index is showing signs that the breakout above the 100 psychological level is proving harder than expected. This week prices saw a strong reversal after a brief attempt, testing the highs of 100.54. With another day’s trading session left, the US Dollar Index should ideally be looking to pare its losses for the week, failing which, the bias shifts to the downside for the US Dollar Index to establish support at some lower price levels.
Data this week from the US has been mostly the Fed Chair, Janet Yellen’s speeches who remained optimistic that the Fed will hike rates in the December meeting. However, the surprise came from the European Central Bank, which despite announcing some policy measures fell short of market expectations, which led to investors and traders covering their EUR short positions and thus putting the US Dollar under pressure.
The main focus today will be the US monthly nonfarm payrolls report. After last month’s blockbuster report, expectations are tame during today’s report with the monthly jobs expected to be 201k down from 271k last month while the unemployment rate is expected to hold at 5.0%. A better than expected jobs report could potentially help the US Dollar pare some of the weekly losses while an adverse report could keep the bears in control.

US Dollar index – Technical Analysis
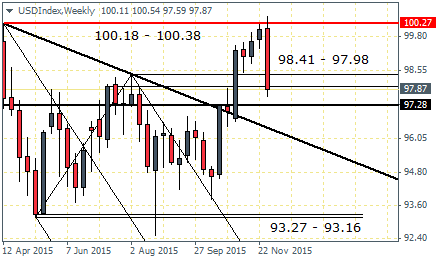
The Weekly charts shows prices trading near the 98.41 – 97.98 level of minor support after prices failed near the 100 level. We could expect a bit of a recovery off this support which could see the US Dollar Index close back above 98.41 level. This scenario would be bullish although one cannot ignore the bearish engulfing pattern that has formed. As such, the US Dollar Index remains on tricky ground for the moment. A break below 97.28, the main support level could see prices retest the previous break out level and the bias could remain neutral for the moment.
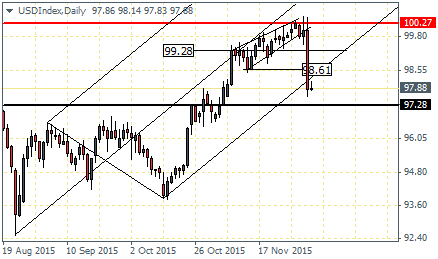
On the Daily Chart, the US Dollar index broke out from the ascending wedge as expected, which showed a perfect confluence with the horizontal resistance at 100. The breakout saw a sharp decline to the outer median line. A dip to 97.28 could provide short term support that could see the US Dollar Index rally back to retest the 99.28 level of minor support/resistance. Only a break above 99.28 would keep the bullish bias intact for a test to 100 and an eventual breakout higher. Either ways, the support at 97.28 will be key as a break below this support level could see prices decline sharply down to 93.85.
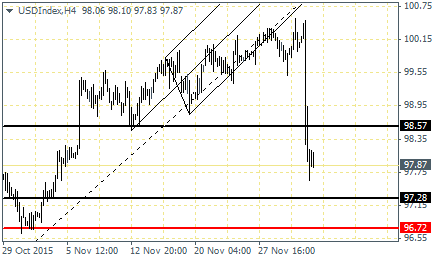
Finally, on the 4-hour chart time frame, the sharp decline off the rising median line pattern and the resulting break below 98.57 shows the US Dollar Index is likely to decline a bit further towards 97.28 support. Price action at this level will be key in the short term. Establishing support at 97.28 could still keep the upside bias intact, provided prices do not breakdown below 96.72 marking a previous higher low. There is also a possibility that the US Dollar Index rally could face resistance at the previously broken support near 98.57.