
The precious metals got a boost last week on the Euro’s surprising rally. Gold prices gained 2.72% last week while Silver gained 3.31% with prices quickly falling back nearly -2.53% this week at the time of writing. The volatile prices in the precious metals markets came about on a weaker US Dollar which fell strongly last Thursday during the ECB’s monetary policy press conference. Despite a stronger than expected November jobs report, the US Dollar index could only recover so much with the short term trend staying neutral for now. We anticipate prices in the precious metals to remain range bound into the December 16th FOMC meeting.
Gold – Technical Outlook
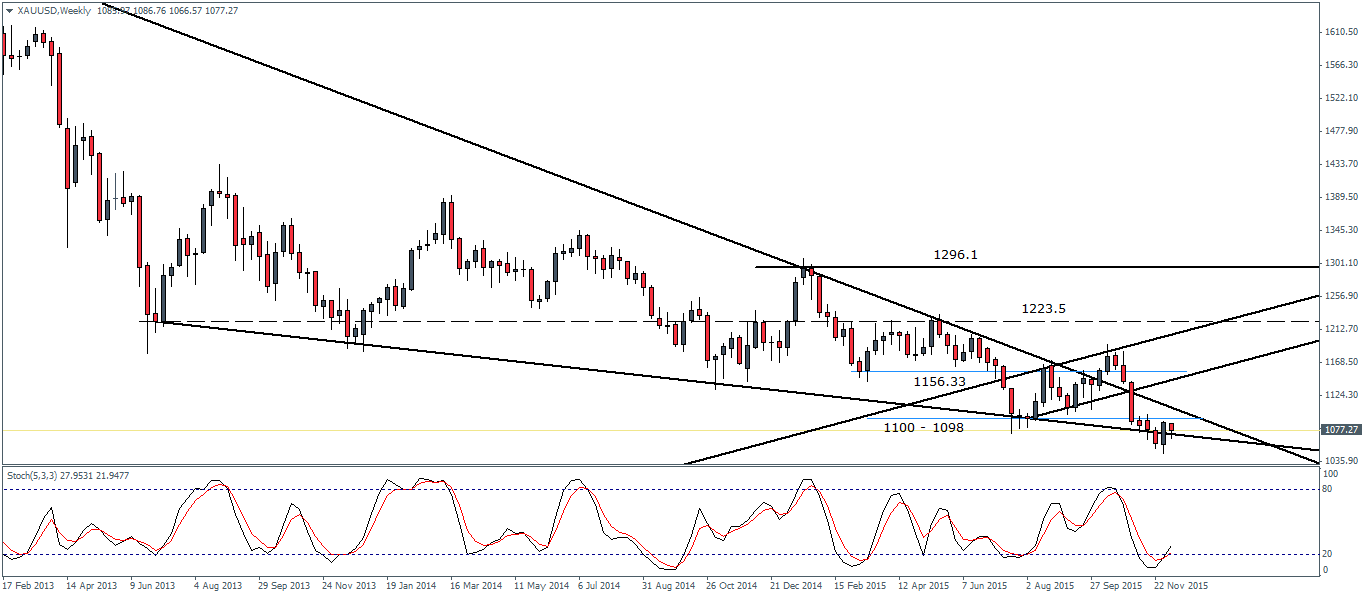
Starting with the weekly charts, Gold prices formed a bullish engulfing near the bottom with prices briefly testing the lows of 1046 before closing back higher. There is a resistance level sitting near 1100 – 1098 region which could be tested in the near term. The weekly Stochastics oscillator has turned bullish near the 20 oversold level strengthening this bias. If the resistance at 1100 – 1098 holds Gold prices could either remain pressured to the downside or move sideways into next week’s main event.

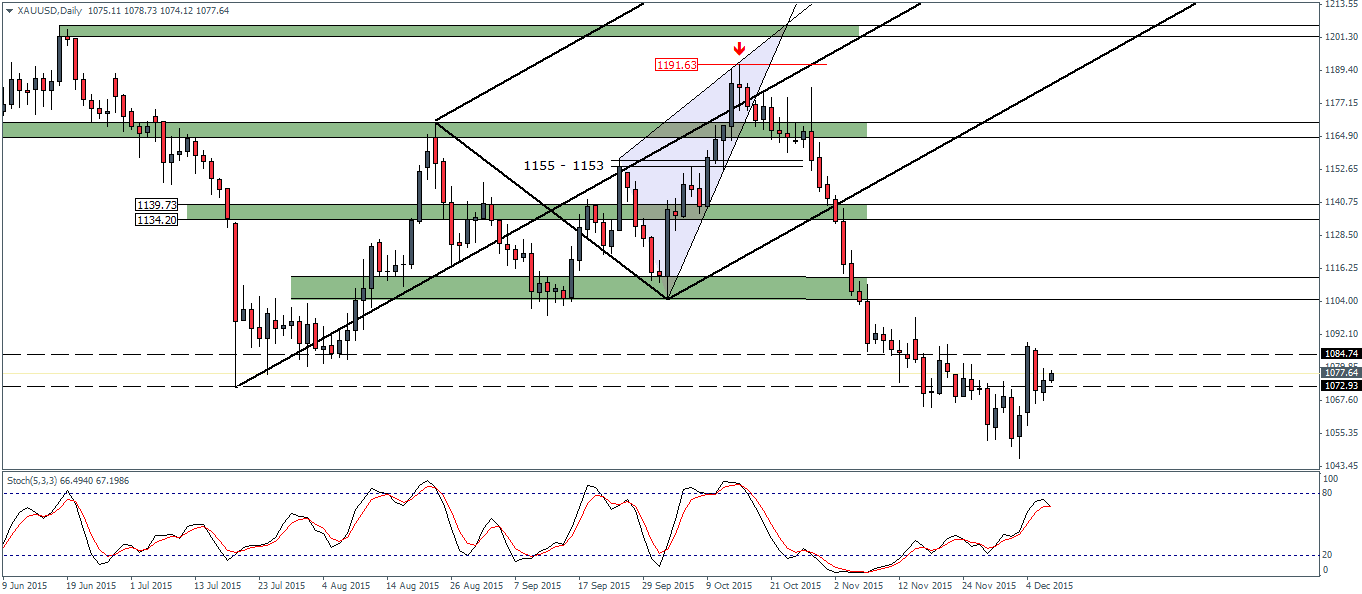
On the daily chart time frame, prices have formed an inside bar on Monday this week following last Friday’s strong bullish reaction. With prices trading within the 1084 – 1072 price zone, the bias remains neutral with a potential breakout in either direction. To the upside, we have the daily resistance at 1104 – 1112, which could be very well tested for resistance after previously acting as support. A pending test of resistance is also due near this level after prices broke out strongly around 5th and 6th of November last month. The daily chart’s Stochastics oscillator has also printed a bullish divergence with a higher low against lower low on price with the possible correction to the 1100 region as pointed. From the above, we can therefore conclude that Gold prices are likely to test the $1100 level of resistance before further bias is established.
Silver – Technical Outlook
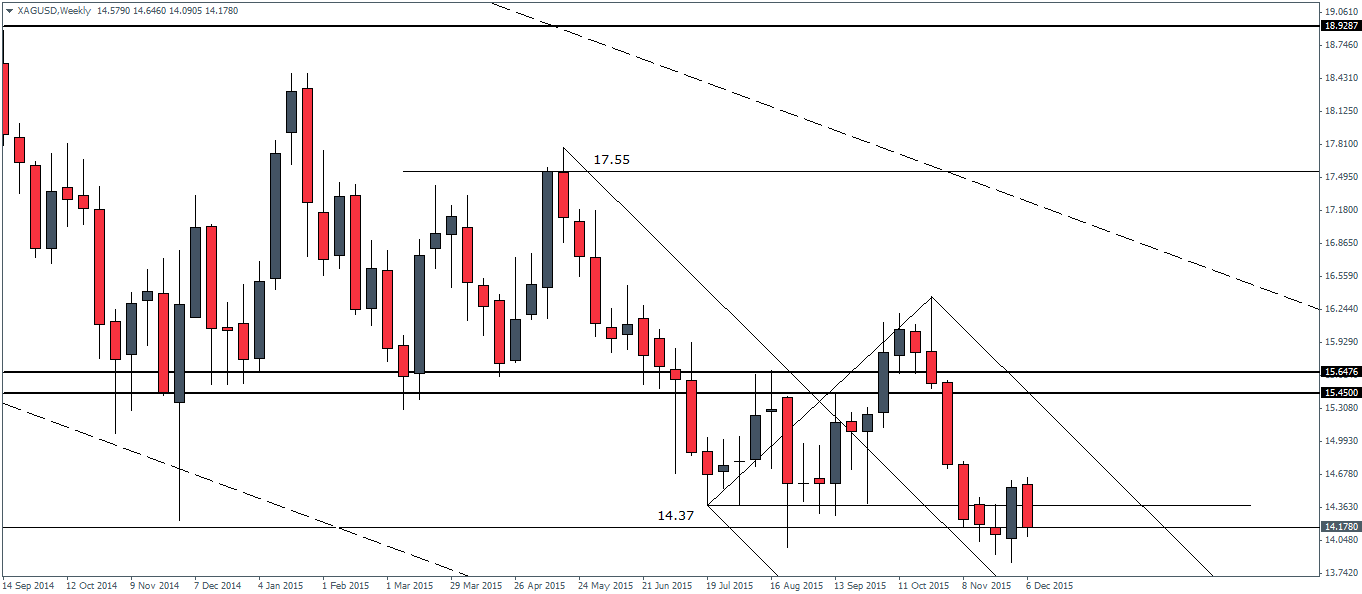
Silver prices have managed to give back all the gains from the week before. However, prices are trading near the $14.37 – $14.18 level of support on the weekly. If prices manage to close within this level or above $14.37, the short term bias could remain to the upside with the possibility of a rally towards $15.45. However, in the event of a break below $14.18, Silver prices could embark on a new leg of declines to the downside.
On the daily chart, Silver prices have been strongly consolidating near the $14.12 level of support with last Friday’s price action spiking higher to 14.56 resistance as noted. With the declines pushing prices back to the 14.12 support, the Stochastics oscillator points to a possible bullish divergence which could see a minimum correction to 15.64 in the near term, on a break above 14.56. Plotting the Median line to the price action, we can see that the price level near 14.12 is a strong support marked by a horizontal support along with the price channel’s upper trend line and the median line itself.
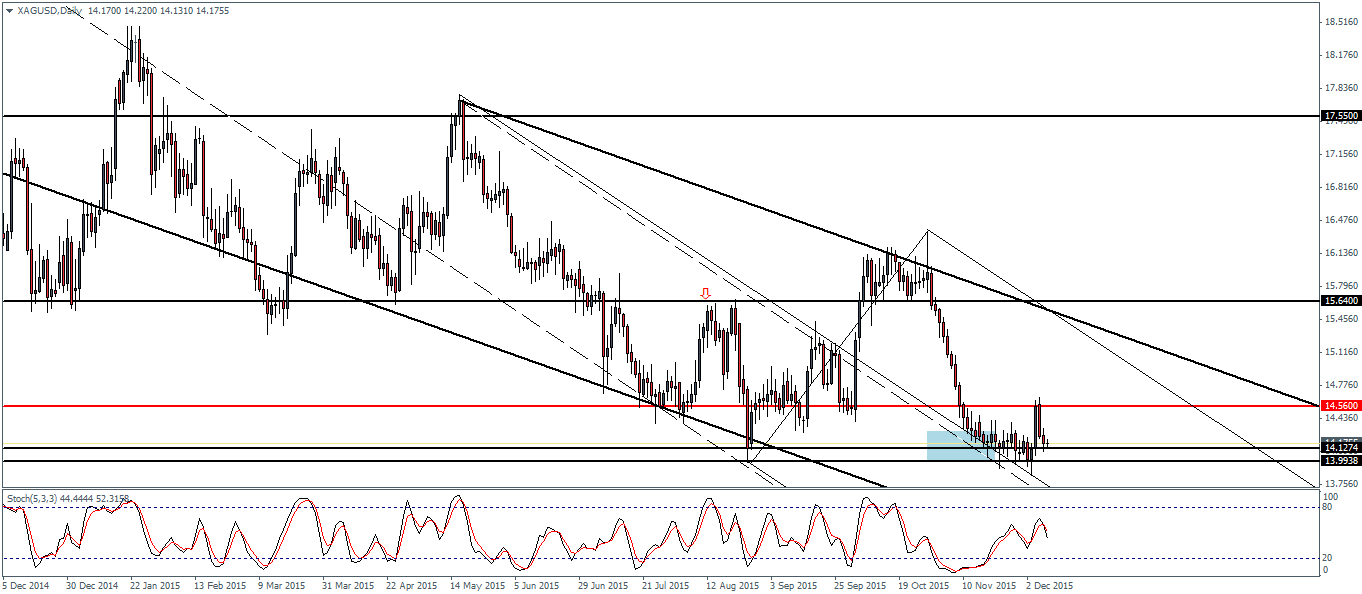
The price region near 14.12 – 13.99 is therefore a support level that could potentially keep Silver prices well supported. For the near term, watch for an initial rally to 14.56 followed by a test of support at this level, which will confirm the rally towards 15.56 – 15.64 level.

