Crude Oil futures bounce off 7-year lows, with further declines possible
US Crude Oil futures continue to move to the downside now into the third week of declines since the OPEC meeting on December 4th where production levels were left unchanged. WTI Crude Oil touched down to $36 a barrel, posting a 7-year lows but quickly managed to bounce off the lows in what could be a possible dead cat bounce yet again. Yesterday, the US EIA released the weekly crude oil inventories which showed a surprise buildup in stockpiles.
[Tweet “WTI Crude Oil touched down to $36 a barrel, posting a 7-year lows, but quickly bounced back”]
Weekly Crude oil inventories rose by 4.8 million barrels surprising the estimates which called for a decline of 300k barrels. The buildup in Crude Oil came after the previous week had shown a strong decline in stockpiles by nearly 3.6 million barrels. The continued decline in Oil prices has made some OPEC members noting that an emergency meeting could be called for if prices continue to decline into February next year. However, the fact remains that with no consensus among the OPEC members, prices are likely to remain subdued into the coming quarters.
Last week alone, WTI Crude Oil fell by -12.12% while this week prices reached a high of $37.85 a barrel before giving back the gains. With the US Federal Reserve hiking interest rates and signaling the start of a tightening cycle, the US Dollar continues to remain well supported for the moment and the stronger Dollar will continue to put pressure on Oil prices in the near term.
Crude Oil Technical Analysis
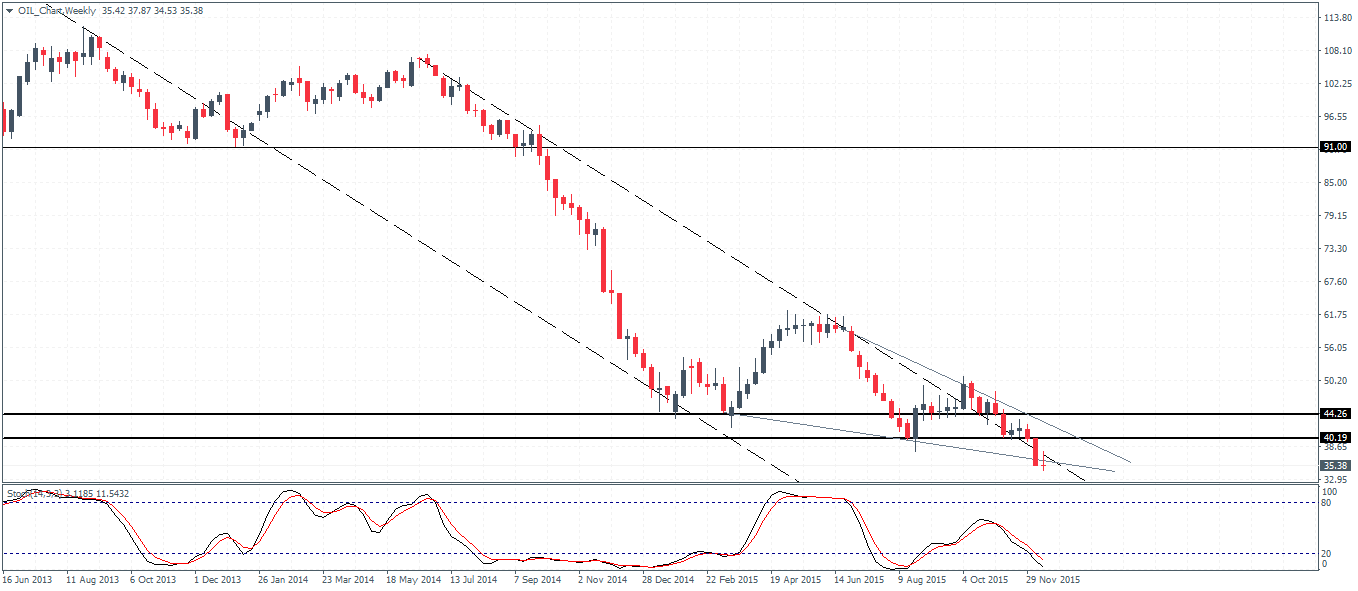
The weekly chart for WTI Crude Oil shows last week closing with a strong Maribozu candlestick pattern with little to now upper or lower wicks or shadows. The Maribozu is known for signaling bearish sentiment in the markets and the appearance of this candlestick shows all but further weakness in the Oil markets.
The weekly chart, however, shows a potential bullish divergence in the Stochastics which is forming a higher low at the time of writing against a lower low in price. If this week closes in a doji or a similar reversal candlestick pattern on the weekly chart, there is some scope for WTI Crude Oil to potentially pull back towards the short term broken support at $40.19 region. The pullback here would establish resistance to the previously known support level and could signal further declines.
Besides the bullish divergence, there is also the falling wedge pattern which could see a breakout to the upside. However, considering that the Maribozu candlestick pattern broke below the lower trendline connecting the lows, the wedge pattern could be very well invalidated. For the moment, while the weekly chart for Crude Oil shows a potential for a correction, further confirmation is needed.
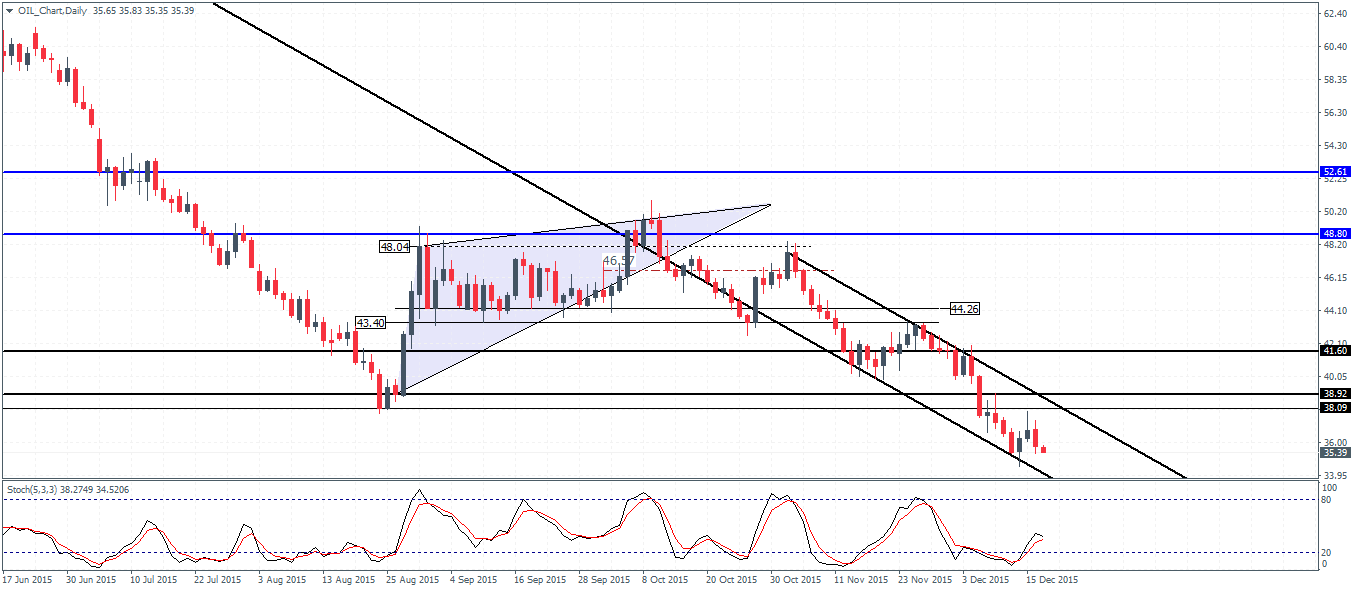
On the daily chart, the break below 38.92 – 38.09 level of support has increased the bearish bias. Prices remain within the new falling price channel plotted but yet again, the Stochastics point to a possible correction towards the aforementioned support level. Yesterday’s price action has formed a bearish engulfing pattern which signals a further move lower but watch for December 11th lows of $35.35, which could act as support. A close below this level on a bearish sentiment could, however, see prices test back the old lows and possibly break lower.