
Crude Oil – Weekly Analysis, 10/12
Crude Oil prices remain very bearish with prices earlier this week trading near a 7-year low. The bearish onslaught in Crude Oil prices came after the OPEC’s meeting on December 4th. Failure to reach an agreement on production cuts between Saudi Arabia and other OPEC members saw the meeting conclude with no major outcomes and the current oversupply remaining unchanged at 31 million barrels per day. With production unchanged and with the next OPEC meeting due in Jun 2016, Oil prices continued to crash gaining momentum on Monday as the markets re-opened. In the last two weeks alone, Crude Oil prices have fallen nearly -10.0%. Besides OPEC’s inaction, commodity prices continued to remain under pressure early this week adding to further weakness in Oil prices.
Yesterday, the US EIA Crude oil inventories showed a surprise drop of nearly 3.6 million barrels per day marking the first decline in inventories in nearly 10 weeks. The markets however ignored the bullish data as Crude oil closed at $37.17 a barrel at the end of the day. The weak Oil prices have put pressure on many oil producing nations including Canada and Norway which are few of the countries that have been hit hard on account of cheaper Oil prices.
Crude Oil Technical Analysis

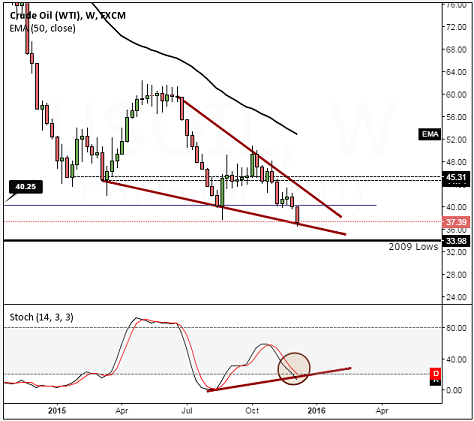
Starting with the weekly charts for Crude Oil, besides the fact that prices are in a downtrend, there is a possible descending wedge consolidating taking place. Comparing prices with the Stochastics oscillator, there is scope for a bullish divergence to play which could see prices break higher in the near term. This view remains valid only on a bullish signal from the Stochastics oscillator and prices will need to reverse off the current lows and make a weekly close above 17th – 21st August lower close of $40.25, which could then pave way for a possible rally towards $45.3.
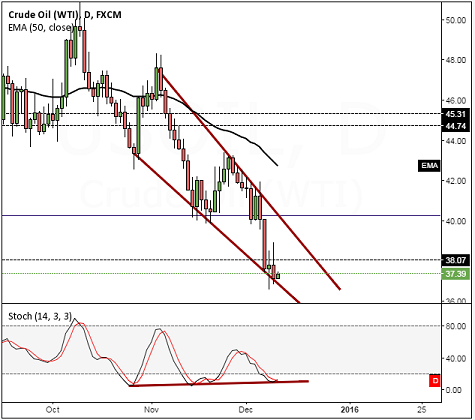
On the daily chart time frame, prices have turned volatile for the past two sessions leaving strong upper and lower wicks. While yesterday’s price action has resulted in a bearish engulfing candlestick pattern, the downside looks limited for the moment. The daily chart’s Stochastics oscillator continues to post modestly higher lows against the lower lows in price. The immediate support/resistance level near 38.07 is a level to watch for. A break above this price zone could see a possible test to $40.25 as the initial support/resistance level to be tested, while a close higher could see a larger rally to the $45 region.
While Crude Oil prices are likely to consolidate at the current levels, next week’s FOMC event will be key in deciding the US Dollar’s strength and weakness as the Central bank starts a new cycle of rate hikes. Oil prices as with most other commodities could remain well pressured on the event. In the event of further declines, WTI Crude oil could test the 2009 lows of $33.98.

![Credit Card 160×600 [EN]](https://assets.iorbex.com/blog/wp-content/uploads/2023/06/13144507/Blog-Banner_EN-Banner_160X600X2.webp)