
The US Dollar Index has gained steadily over the past three weeks. On average, the Dollar Index notched up gains of nearly 4.72% from the lows at 94.68 during the week of 19th September to forming an interim top at 99.15 on the week of 2nd November. The strong momentum led rally is however likely to see a modest pullback ahead of further gains to the upside. The weekly chart for the US Dollar Index shown below depicts the triangle break out off the weekly time frame, indicating to further strength in the Dollar Index over the next few months.
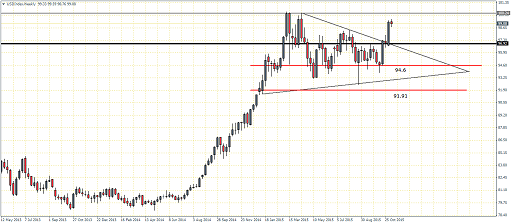
At the time of writing, the weekly session is showing a bearish sentiment. If valid, a decline to the break out level at 96.92 is very likely. Establishing support at this level could potentially pave the way for a renewed strength in the Dollar Index which could then aim for 100.24 level of resistance. Any upside rally without a test of support at lower levels is likely to be short lived considering the strong psychological and technical resistance at the 100 mark.
To the upside, therefore, a test of support at 96.92 could set the stage for the US Dollar Index to break above 100.24 and eventually target 105.7 region, marking a measured move from the triangle’s range. Alternatively, to the downside, a break below 96.92 must see a rally back to this level to establish resistance. In such an event, if resistance is established at 96.92, the Dollar Index will likely find support near 94.6 followed by 91.90

On the 4-Hour chart time frame, the Stochastics oscillator is failing to confirm the new highs in prices, resulting in a bearish divergence taking shape. A breakdown of prices could see a correction to 96.92 through 96.62, which will mark the correction. Given that this level coincides with the break out level from the Weekly chart triangle pattern, it makes for a strong support.
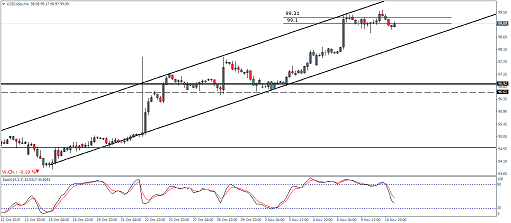
The dip to 96.92 – 96.62 is likely to offer some short term support to the US Dollar as the next upside leg could see the Dollar Index aim to test the 100 psychological level.
For the near term, if prices fail to break above the short term resistance at 99.31 through 99.1 the downside correction could be confirmed.
A short term weakness in the US Dollar Index would mean that most of the USD cross rates could see a short term rally, posting a recovery from the past few weeks. The US Dollar Index technical analysis points to the fact that the US Dollar remains strongly biased to the upside and the dip to 96.92 through 96.62 could offer a good level to load up on USD long positions.
There is however the risk of the support at 96.62/96.92 giving way. In this scenario, any move to the downside will need to be validated by a retest to this broken support for resistance. If resistance is indeed established, the Dollar Index could look to posting a strong decline below this broken support, which could see the USD cross rates post much stronger recoveries than expected.

