
The downtrend in the metals market has seen a sharp slump in prices across the board. Gold prices have declined sharply by -9.06% since the interim top formed on the 19th of October at 1177.94. At the time of writing, Gold is trading near a 5 and half year low of 1071.23. With Silver, prices have declined by a massive -11.05%, trading near a 6 year low of 14.23. The declines in the metals markets was sudden as the Fed surprised the markets at the October FOMC meeting noting that the decision to hike rates would be taken in December. With an improved unemployment rate dropping to 5.0% combined with stable inflation prices, the markets are pricing in a 25bps rate hike from the Federal Reserve this December.
The main risk to the markets will of course be today’s FOMC meeting minutes, from the October meeting. If the minutes reveal the continued hawkish stance from the Fed metals and commodities at large could continue to see a persistent downtrend playing out, albeit the momentum could show signs of exhaustion. In such circumstances, even a minor setback could see a short squeeze play out in the markets posting a correction in the near term.
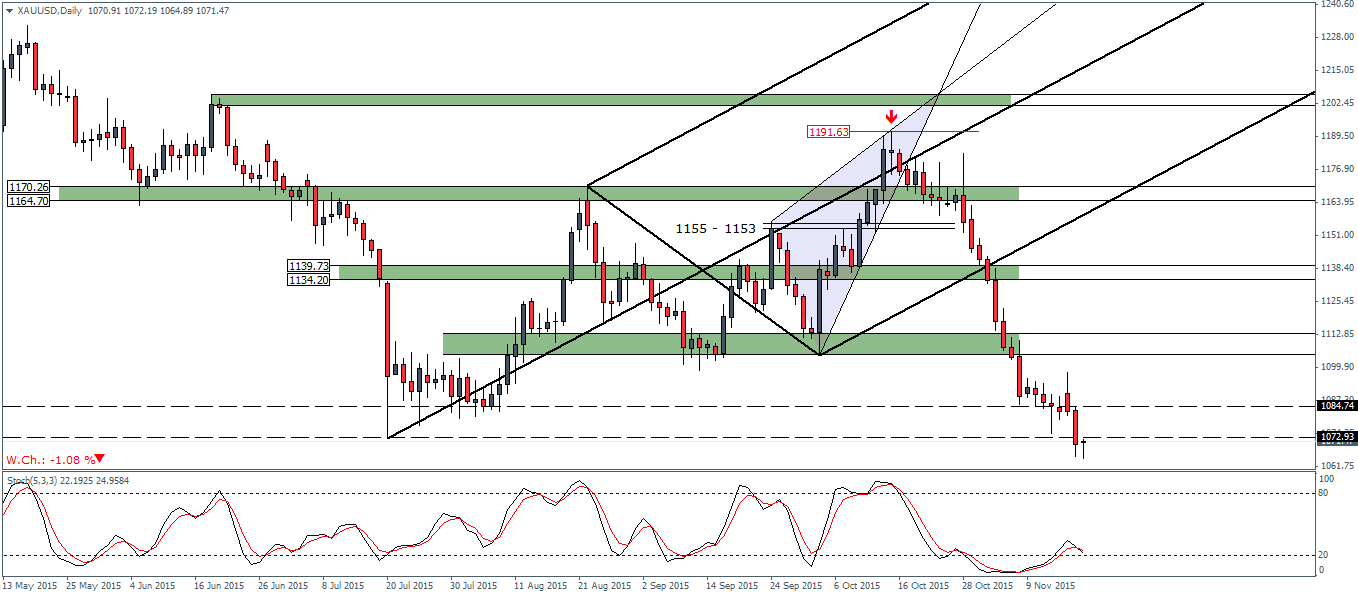
Gold – Technical Outlook
On the weekly charts, prices are trading near the longer term declining trend line connecting the 30th June 2013 lows and the 2nd August 2015 lows. A weekly close below this trend line could confirm continued bearish price action in the precious metals markets. To the downside, the next main support comes in at 1002.62 region followed by a lower support coming in at 723.38. Plotting the median line on the weekly charts, we can expect to see prices test the median line. A strong bearish close below the median line could hasten a decline towards 1002.62 level, with the bleak possibility of a retest to 1072.52 to establish resistance off the recently broken support level.

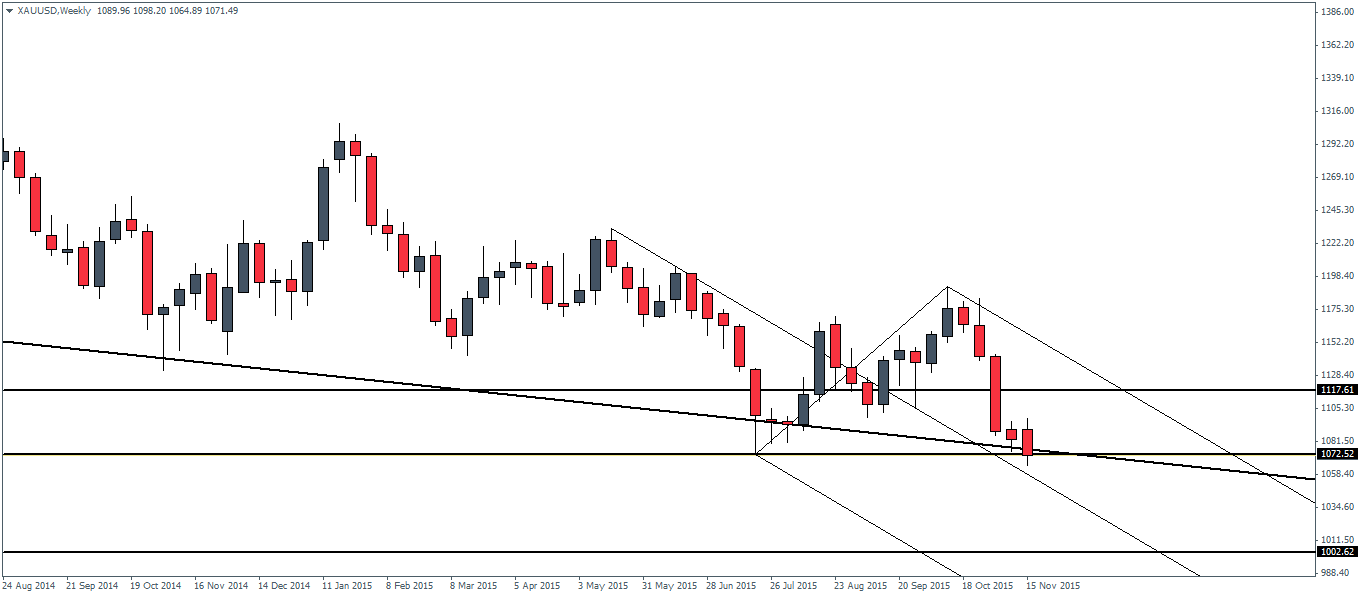
On the daily charts, price action is currently in the support zone between 1084 – 1072 region. A consolidation at this price zone could see prices trade sideways ahead of a renewed decline lower. Alternatively, in the event that Gold manages to close above 1084, a retest to the resistance level at 1104 – 1113 region could be seen as a potential pullback zone while the bias continues to remain to the downside.
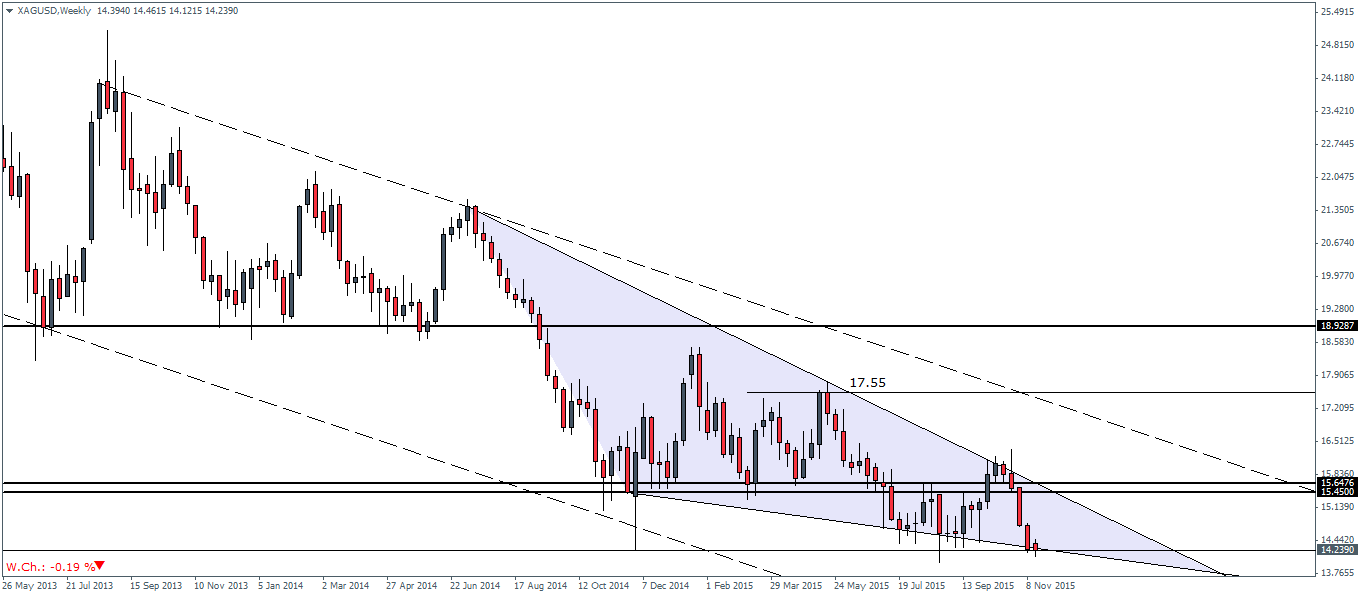
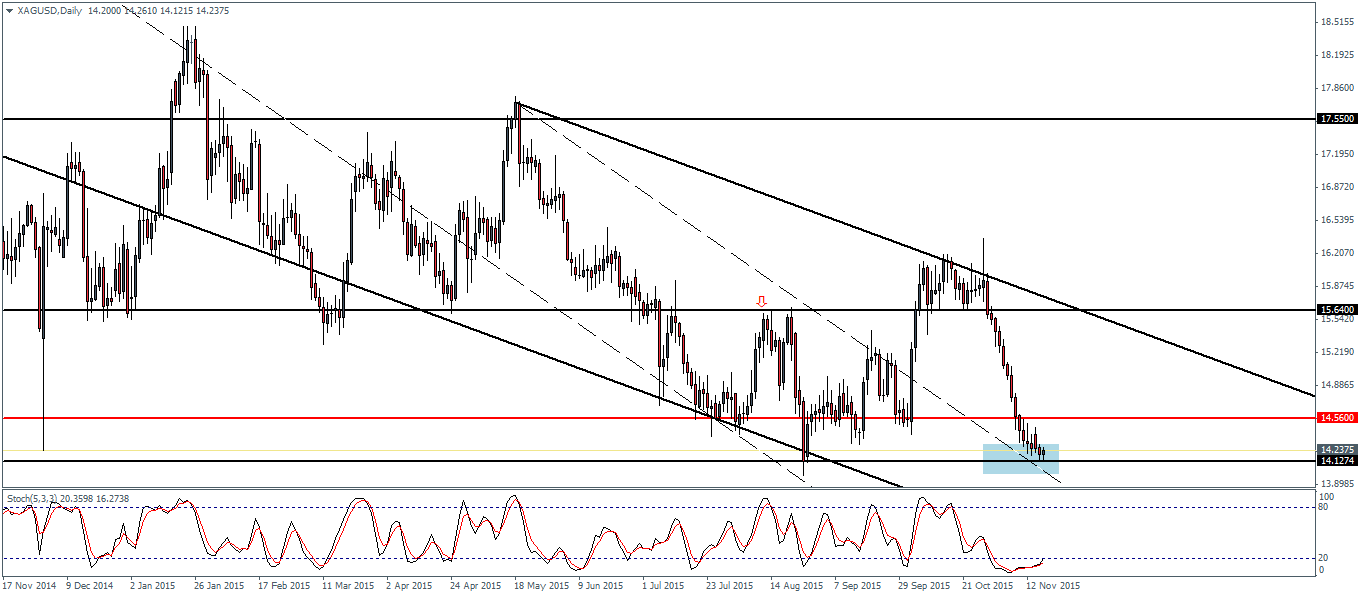
Silver – Technical Outlook
With Silver, price action is trading near the lower trend line of the falling wedge pattern. The declines came about after failure to hold above 15.64 – 15.45 level of support. There is however a scope that any bounces could be tested back to this broken support level, but the weekly charts will show the medium term outlook. A break below the lower trend line of the falling wedge pattern will signal a continued decline lower with the next main support coming in at 12.34.
On the daily charts, price action is trading near the previously identified price zone of 14.12. Any bounce off this support level could see a retest to 14.56 level where resistance can be established off the broken support level. A pullback to 14.56 would mark a short term correction in Silver prices while the bias continues to remain to the downside.

![Credit Card 160×600 [EN]](https://assets.iorbex.com/blog/wp-content/uploads/2023/06/13144507/Blog-Banner_EN-Banner_160X600X2.webp)