
Crude oil futures pare gains on inventories build up
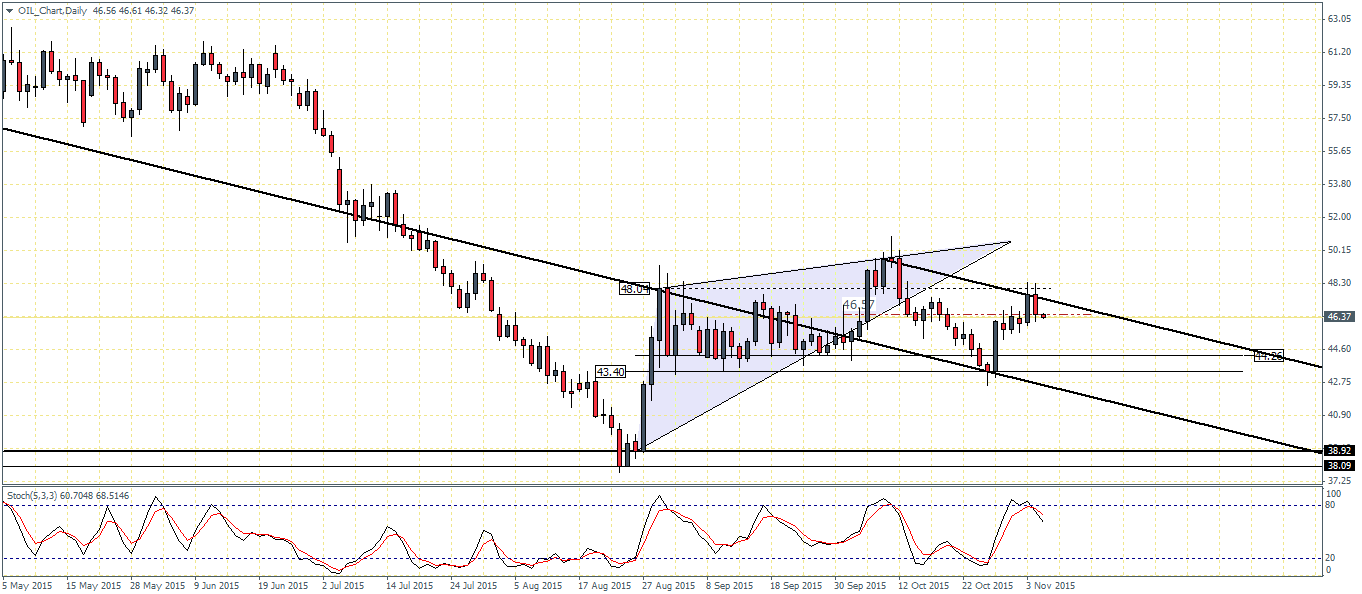
Crude Oil futures, trading at $46.38 a barrel is shaping out to be volatile this week after prices closed on a bullish note last week, testing the lows of $42.58. Prices have currently formed an inside bar after the strong bullish candlestick pattern formed on 3rd November. A breakout to the downside could see a potential correction in the near term. The rally earlier this week came about as Oil supplies were disrupted on account of a strike at Brazil’s Petrobras Oil production company and the closer of oil exports port in Libya. Crude oil tested a weekly high to 48.33 this week before easing back.
Yesterday’s Crude oil inventories report showed US crude oil stockpiles rising more than expected to 2.8 million barrels, beating estimates of 2.5 million, for the week ending October 30th. The report showed an agreement with the American Petroleum Institute’s data which was released on Tuesday, showing that domestic production was 9.16 million barrels a day, up from 48k barrels a week earlier. Yesterday’s data marks a 6th consecutive week of increase in Crude oil stockpiles. Besides the oversupply and build up in Crude oil inventories, the stronger dollar in recent days has also added to the pressure to keep prices subdued.
Crude Oil Technical Analysis

From a technical outlook, Crude oil’s rally eventually broke above $46.57 level as noted in last week’s analysis. The strong rally saw prices test the upper resistance level at $48.04 before prices reversed lower. The inside bar formed just below this resistance is likely to see the declines test $44.26 level of support which has so far held out strongly.
Plotting the price channel, support is clearly seen between $44.26 and $43.40 on the daily chart and the declines are likely to test this support in the near term.
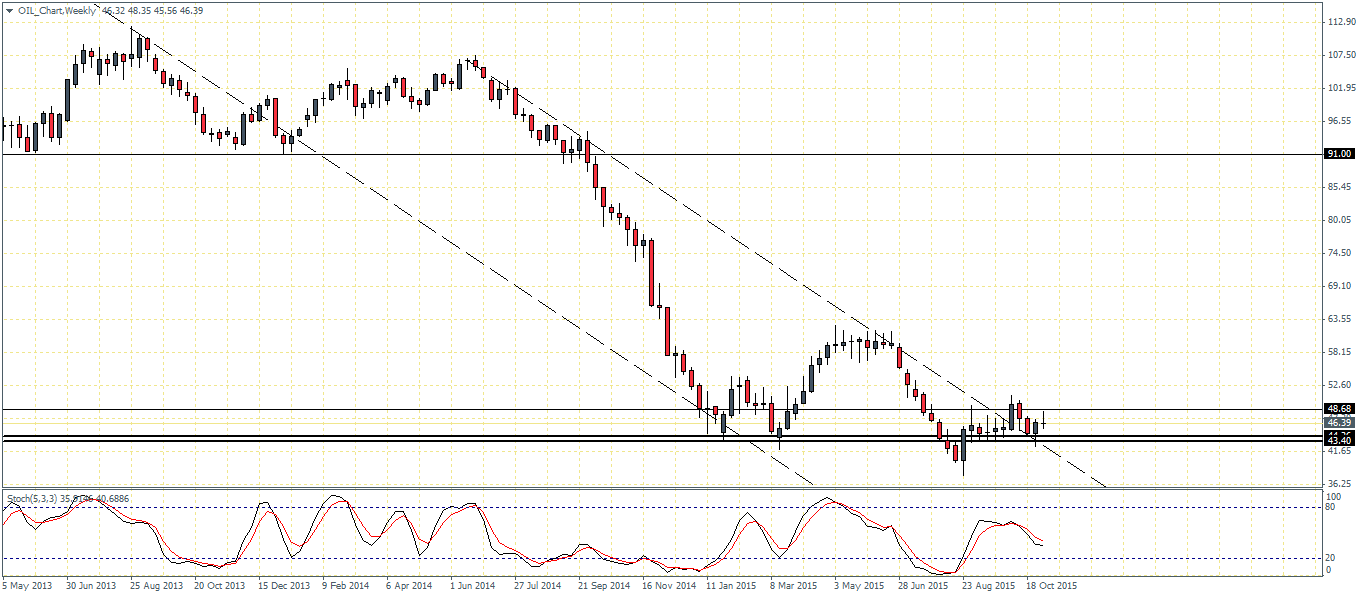
Looking to the weekly chart time frame, prices are attempting to break out from the falling price channel and the support levels of $44.26 through $43.40 are also marked. A retest to this level could see prices set up for a potential rally in the near medium/long term. However, a break below the support from the weekly session could see Crude Oil gain bearish momentum, potentially testing previous lows near $37.76.
Looking forward, it is unlikely that the rally in Crude oil will be sustained and only a decline lower is very possible based on the strength of the US Dollar and with production continuing to outstrip demand. The monthly charts do not show any conclusive directional bias and it could be that Crude oil prices could continue to range in the near term.

