
The US Dollar Index has declined nearly -0.69% for the week led by losses from last week’s NFP data. The weak jobs report saw the Greenback coming under selling pressure, which was further exacerbated by yesterday’s FOMC meeting minutes which showed that the Fed members were concerned about inflation expectations failing to reach the 2% target rate and the potential risks of hiking rates ahead of inflation. While the US jobs report has been the sole data point for the US which has fuelled the rate hike debate, inflation remains on the downside. With no hikes in September and October likely to see the Fed stand pat on policy, the US Dollar Index could see further downside. The futures markets expect the rate hikes either in December, which in itself is also starting to scale back its expectations while the view for a US Fed funds rate hike in Q1 of 2016 remains on the table. However, considering that the first quarter of the year usually see’s a low GDP print in the US economy, the downside pressure in the US Dollar could likely remain at least until March/April of 2016. This downside view shows a confluence of both the fundamentals and the technical analysis as well.
US Dollar – Technical Analysis
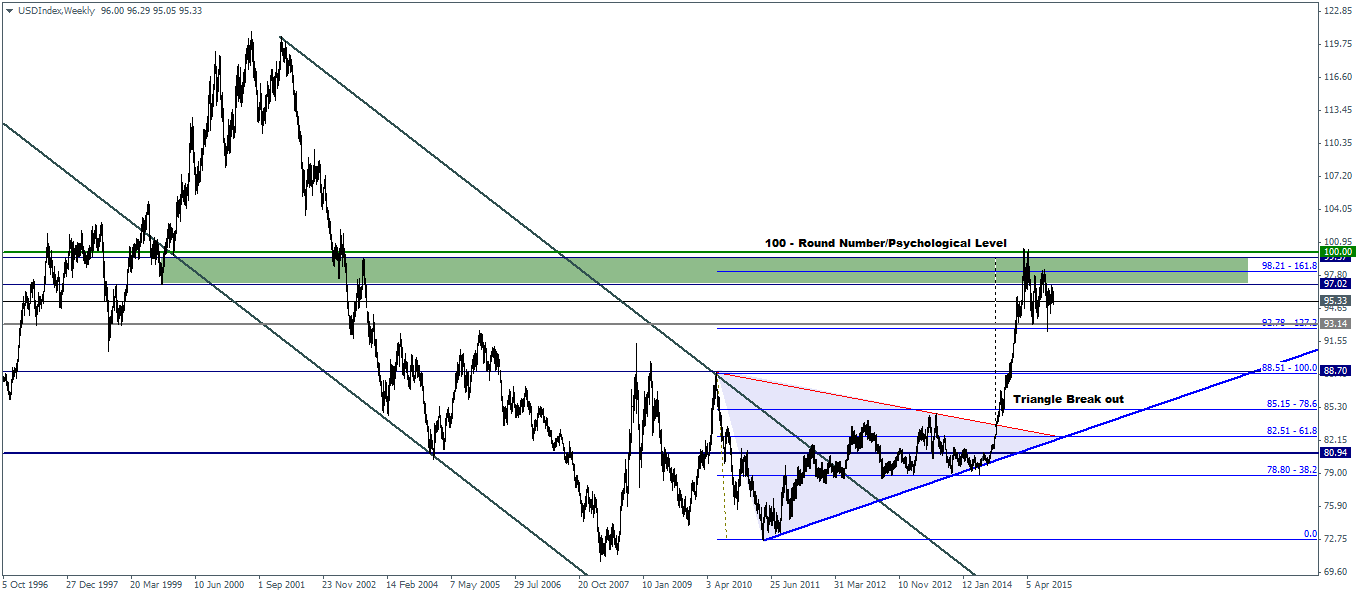
The US Dollar Index looks to have established a top near the 100 psychological level confirmed the lower high at 97.54. A weekly close below 93.27 will be the next main level of interest as a break below this level could see prices post a lower low. The weekly chart which showed a bear flag pattern will also be validated on a close below 93.27 support level, with the measure move targeting a minimum decline to 89. There is a major support zone between 91.4 through 89 which could see prices move sideways rather than expecting a sharp continued decline.
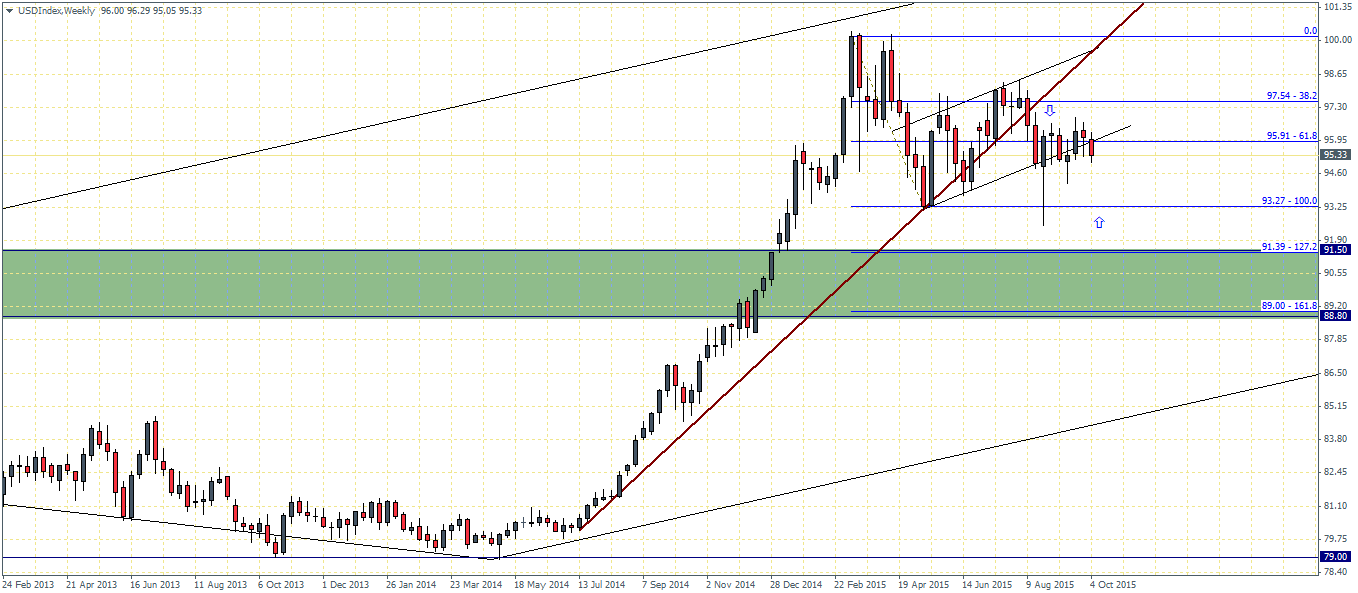

Looking at the weekly chart from another perspective, we can see that a retest to the 89 – 88.51 level will mark a retest of the short term top/resistance that was formed ahead of the triangle/wedge pattern which saw prices break out to the upside. A retest back to this resistance to establish support will eventually set the base for another attempt to test the previous highs near 100 and perhaps even break the resistance level between 97 through 100.
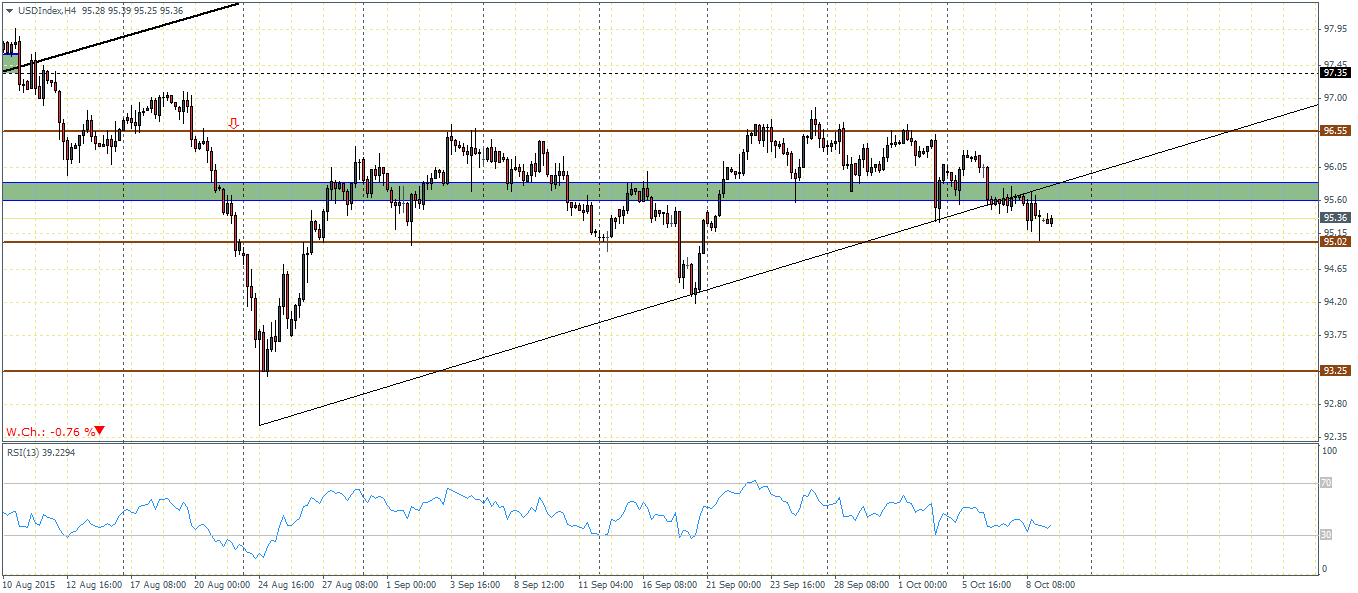
On the 4- hour chart time frame, the US Dollar Index looks to have cleared the major support zone near 95.85 through 95.6 with a potential test to 95 which marks a short term level of support. We expect a bounce off 95 to retest the support zone that was broken to establish resistance. This could confirm the move to the downside, which will eventually see 93.25 being the next level to be contested. The support zone between 95.85/95.6 also marks the break of the major rising trend line which further validates this view.

![Credit Card 160×600 [EN]](https://assets.iorbex.com/blog/wp-content/uploads/2023/06/13144507/Blog-Banner_EN-Banner_160X600X2.webp)