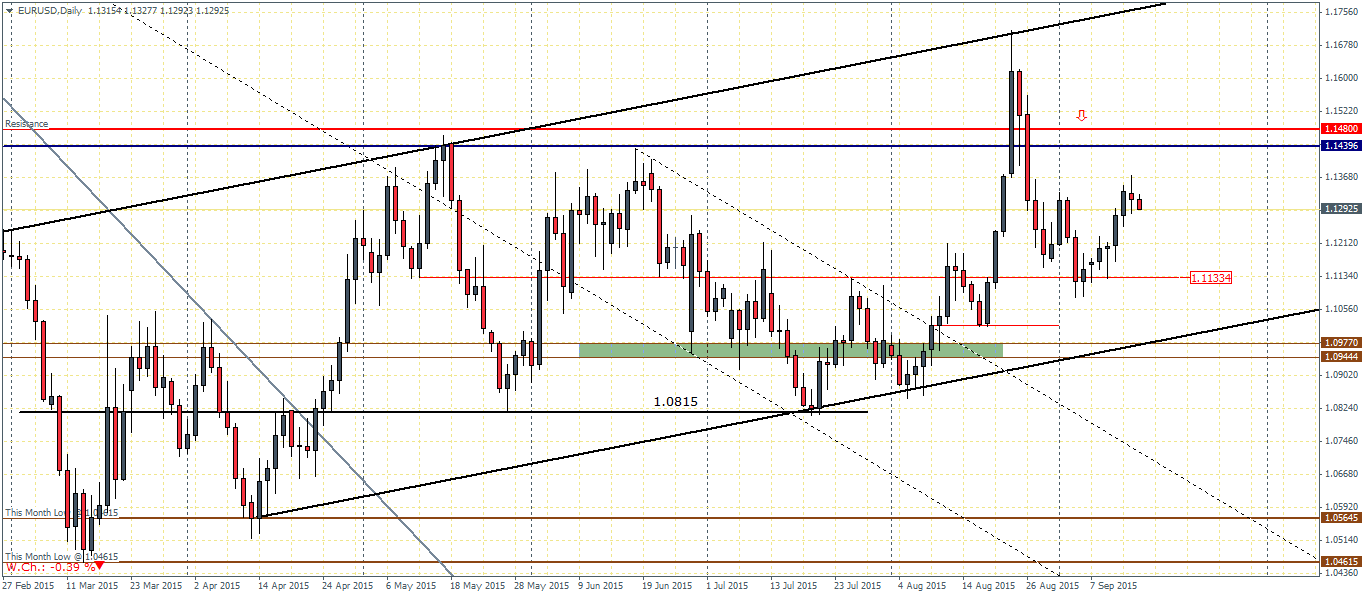
EURUSD (1.12): The single currency has been attempting to trend higher but momentum seems to be losing steam near the previous lower high of 1.1315 region. At the time of writing, price action is pointing to a strong reversal on the daily charts near this level. To the downside, the immediate support level comes in near 1.1133 region, marking the previous reversal low. A test to this support could confirm an established support level. The bias still remains to the upside with the pending retest to the previous resistance level near 1.148 – 1.144 being a possibility and where any rallies could potentially hit a roadblock. For the moment, the small bodied spinning top pattern has signaled a weakness to the upside and could be confirmed if we see a strong bearish pattern today.
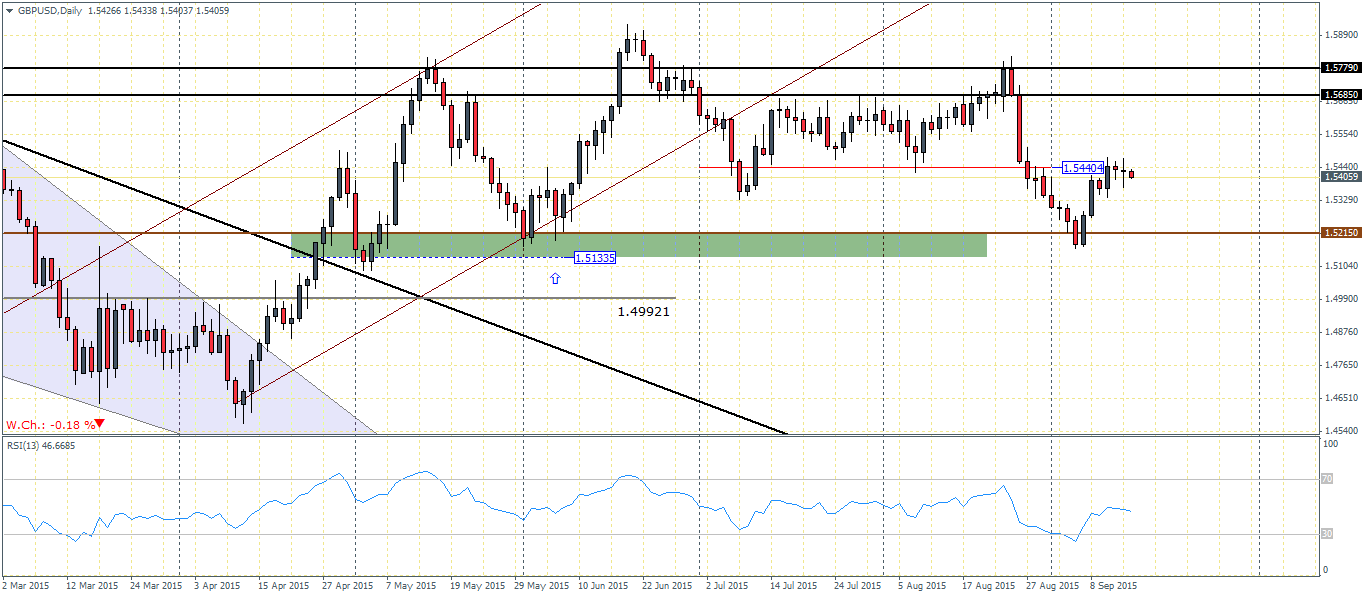
GBPUSD (1.54): The Cable staged an impressive rally after hitting the lower support near 1.5215 which saw a strong rally taking the Cable to the minor resistance level of 1.544. Price action here is also pointing to a potential stalling of the upside rally which could indicate either a sideways price action here on or a possible decline back to 1.5215 support. We will need to see a strong rally and a close above 1.544 level in order to change the bias to the upside which could then see a rally testing the previous resistance at 1.5685. In the unlikely event that GBPUSD fails at the support of 1.5215, a sharper correction could no doubt see GBPUSD fall to 1.50 round number support before further declines to 1.4992 region.

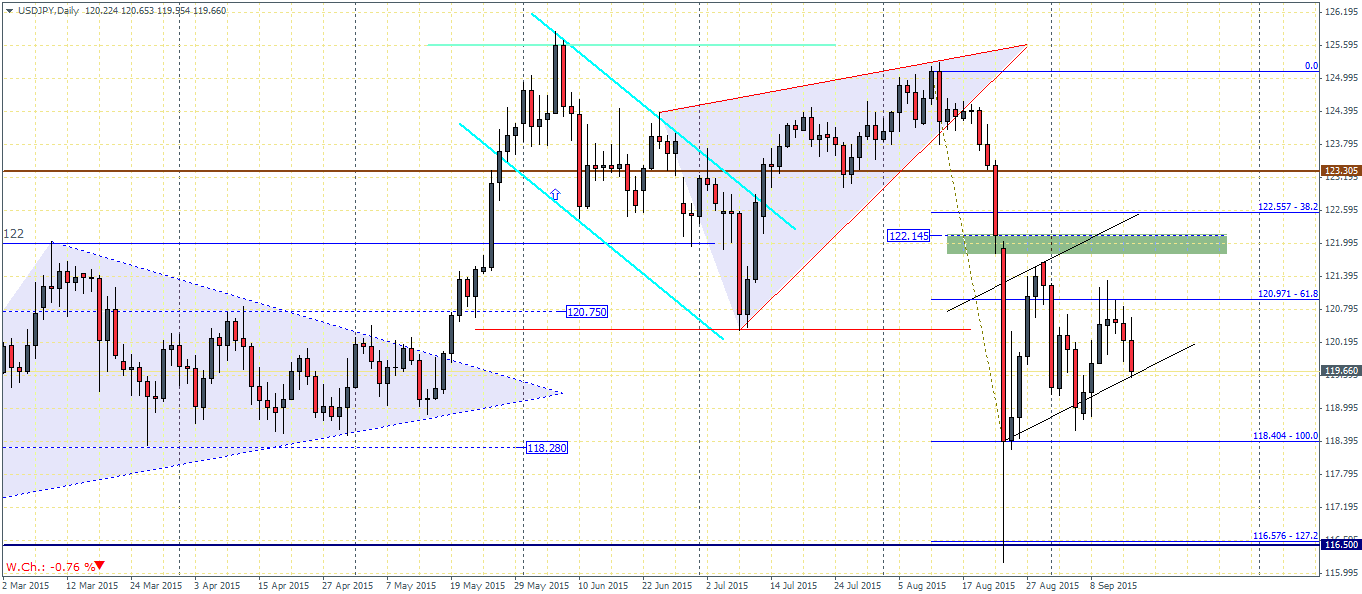
USDJPY (119.5): As noted in the previous weekly technical forecast, USDJPY looks to have cemented its position for a decline to the downside marked by the reversal candlesticks near 121.5 region and the more recent lower high formed near 121 region. Price action is currently trading within a larger bear flag pattern with the immediate support coming in at 118.4 region. A break below this support could see USDJPY test the lower support at 116.576 and eventually to 114.25 if price can complete the bear flag’s measured move target. To the upside, the bias could change on a close above 120.97 in which case, 122.145 will be a level to watch ahead of 123.30
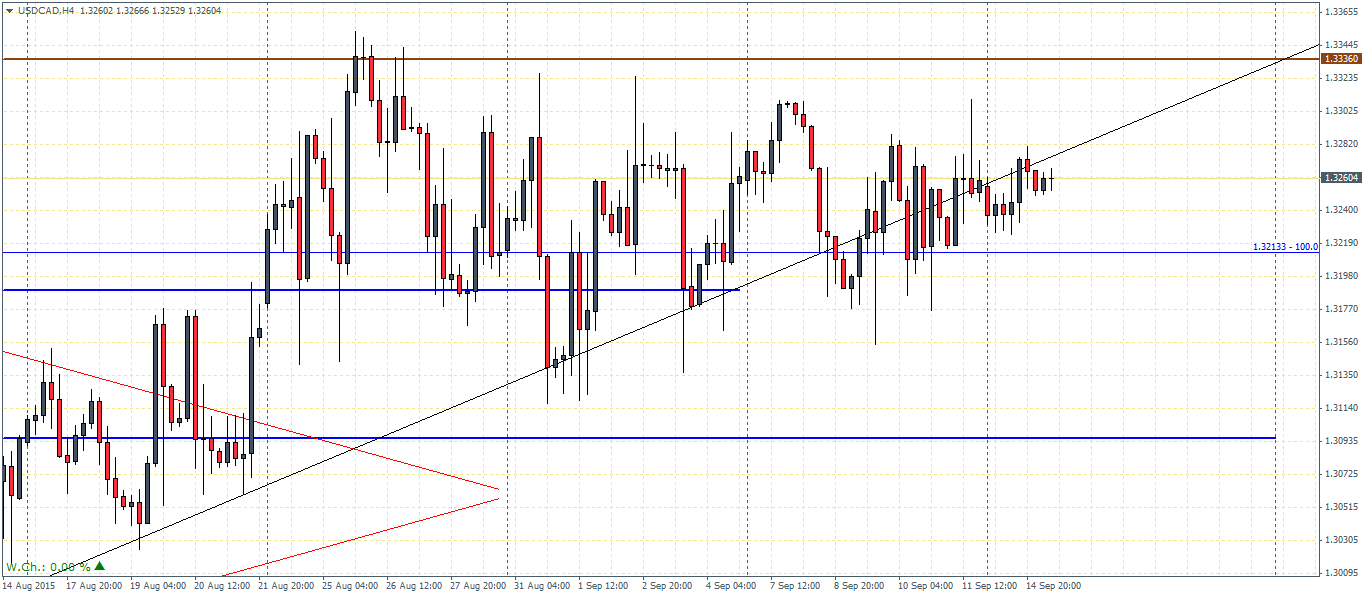
USDCAD (1.32): USDCAD has been trading very choppy since last week and the sideways price action is possibly pointing to a strong break out in the near term. Price is still supported above 1.32133 as we noted last week. The bounces off this support level however have failed to see the USDCAD rally higher towards the resistance of 1.3336 region. With the strong consolidation, we expect to see the support at 1.3213 possible give way for a further decline to the downside, in which case a test to the lower support at 1.30935 could be a possibility.
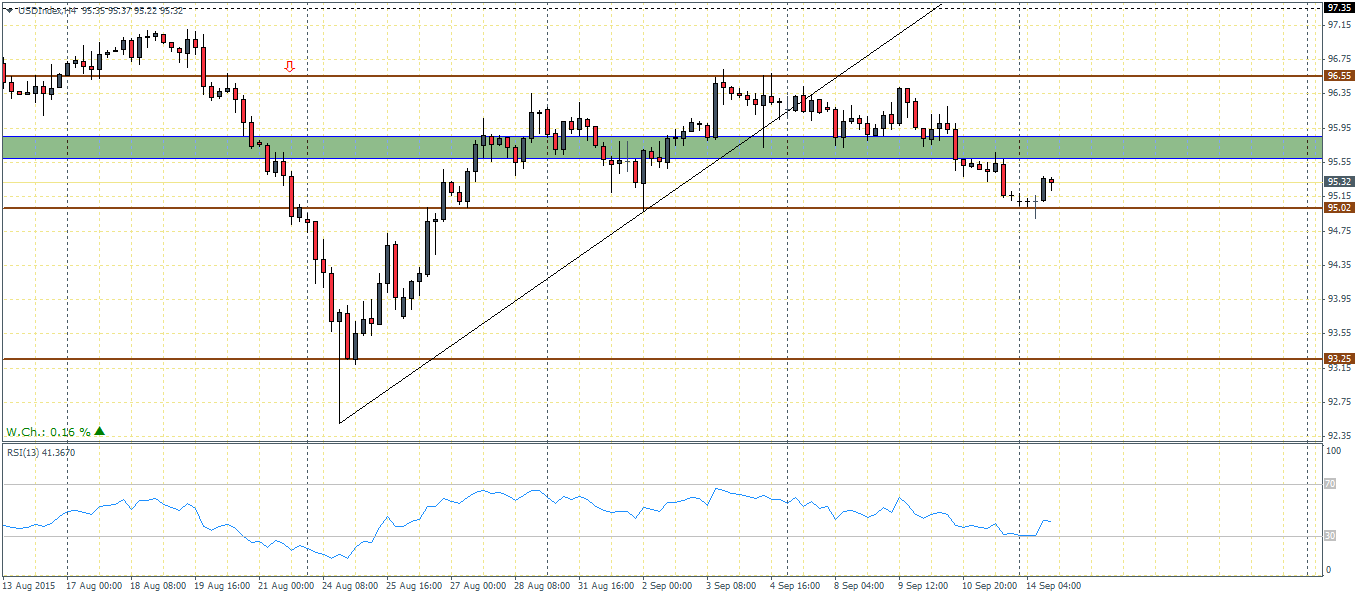
US Dollar Index (95.32): The US Dollar index cleared the support between 95.85 – 95.6 region and formed a doji pattern near the support at 95. We could expect the current bounce to retest the broken resistance in order to establish support. If prices fail to rally above this broken support, the US Dollar Index could be looking to a sharp decline to 93.25 which marks the next main level of support. To the upside, a close above 95.85 will still see strong resistance from 96.55 region which could potentially attract new sellers into the market and could keep prices pressured to the downside.