
The technical analysis for the US Dollar Index is pointing to a potential decline both in the medium and near term. For the most part, the US Dollar Index has failed to rally above the previous highs above 96.25. On the weekly charts, a bearish flag pattern has formed which cautions to a price decline in the near term and shows strong confluence with the major support levels between 91.4 through 89, a long term support level that has managed to hold prices.
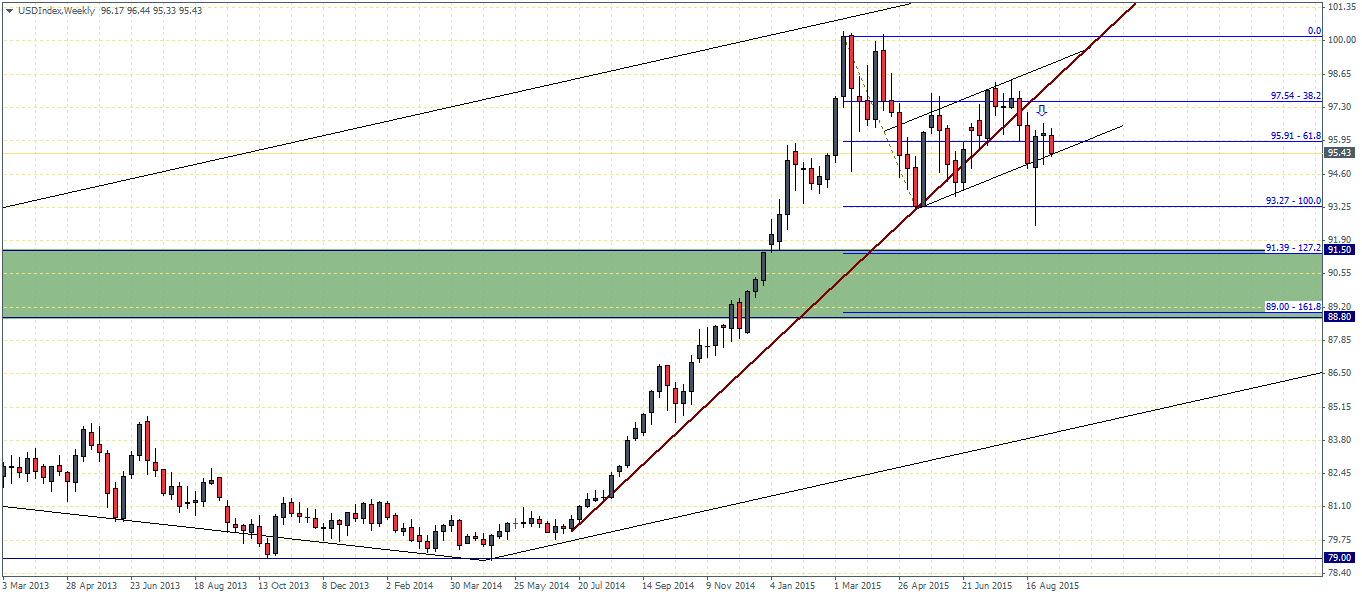
There is an upside risk to the above main analysis as price could see a possible test to the break out of the trend line near 96.55 – 97.55 region. The bearish scenario would be validated as long as prices do not close above 97.55 on a weekly basis. In such an event, the US Dollar Index could well post some strong declines lower. Alternatively, if prices manage to close above 97.55, then it would invalidate the bear flag analysis as prices could potentially rally higher with the possibility of breaking above the previous resistance at 100.
US Dollar – Technical Analysis

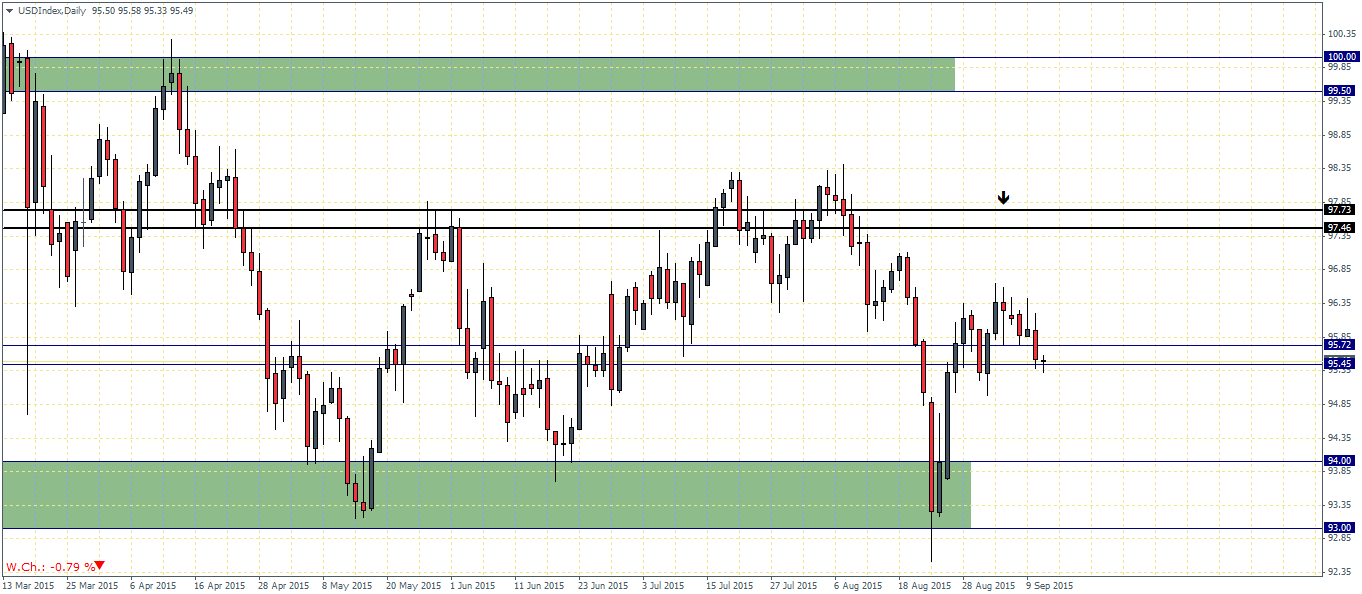
The US Dollar Index has been trading sideways for the most part with no major shifts to the trend. Price action is currently trading near the major support level of 95.72 – 95.45 region which could be a critical level considering that in the event support holds, the US Dollar Index could potentially rally towards the next main resistance level of 97.73 – 97.46 region. Alternatively, if the support gives way, the US Dollar index could decline towards the next main support at 94. The sideways price action in the US Dollar Index is in line with the Fed’s FOMC meeting next week and due to the uncertainty surrounding the interest rate hike decision, the US Dollar Index could very well look towards ranging sideways into the event.
On the weekly charts, price action in the US Dollar Index is pointing to a weaker close for the week and is also marked by the reversal candlestick pattern that we are currently seeing. A bearish close for this week could signal a potential decline to the downside with the largest support at 91.5 being able to support the declines in the US Dollar Index, ahead of the minor support level near 93.25.
Looking forward, the US Dollar Index could come under significant risk heading into next week’s FOMC interest rate decision. With the market opinion being finely divided, it would be a tough call to make in terms of whether the Fed chooses to hike rates or not. Later today, the US Producer Price Index data is due followed by the University of Michigan inflation expectations, both of which can offer insights into the potential inflation expectation sin the near term. An upbeat data could potentially see the case for the Fed to tighten rates. However, considering that the Crude Oil prices have been trending lower for the past month, it would potentially translate to a weaker PPI reading that could point to a weaker inflation outlook.

