
The US Dollar Index has been trading fairly stronger this week with the week to date gains of 0.16%. However, the main test to the Index comes from today’s nonfarm payrolls report which could shift the bias in either direction. On the weekly charts, last week closed with a bullish piercing candlestick pattern which signals a potential move to the upside. The immediate levels from the weekly charts come in at 98.10, while the downside looks to be supported near 94.9 – 95 level which was already tested over the week. The main risk comes from the fact that the markets will be looking to seek early positioning ahead of the Fed’s FOMC meeting later in the month, which means that depending on how the NFP numbers are printed today, the market sentiment could swing in either directions and perhaps with a lot of volatility.
US Dollar – Technical Analysis
The daily charts for the US Dollar Index shows that price action is trading comfortably above the support at 95.72, meaning that the potential for upside is very much a possibility. Resistance on the daily charts comes in near 97.73 – 97.46 levels, which sits close to the 98/98.10 level of resistance noted from the weekly charts. In the unlikely event that the US Dollar Index falls below the current support at 95.72 – 94.45, the final line of defence comes in at previous lows of 95. A break below 95 would signal a bearish continuation with a drop to 94.
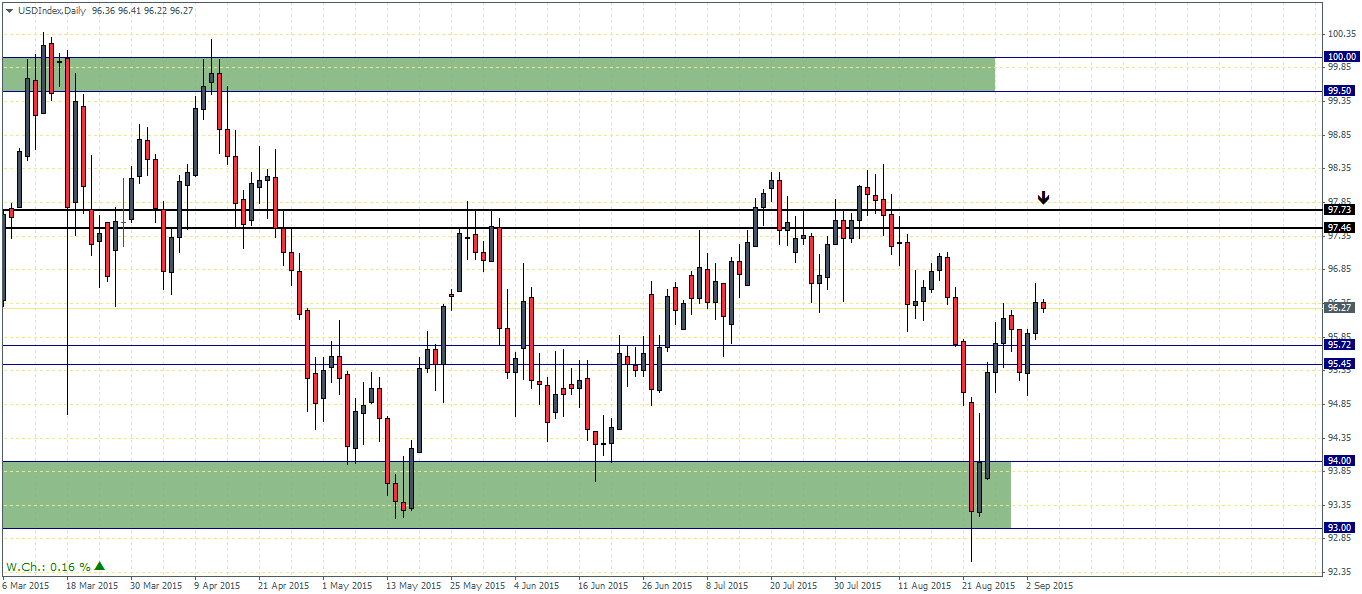

In the coming weeks, or in the run up to the FOMC event due 16/17th September, the US Dollar Index could remain range bound within 97.45 – 95.72 levels of resistance and support, unless we get to see a break out above 97.7 which could then shift focus to the next main resistance at 99.5 – 100.
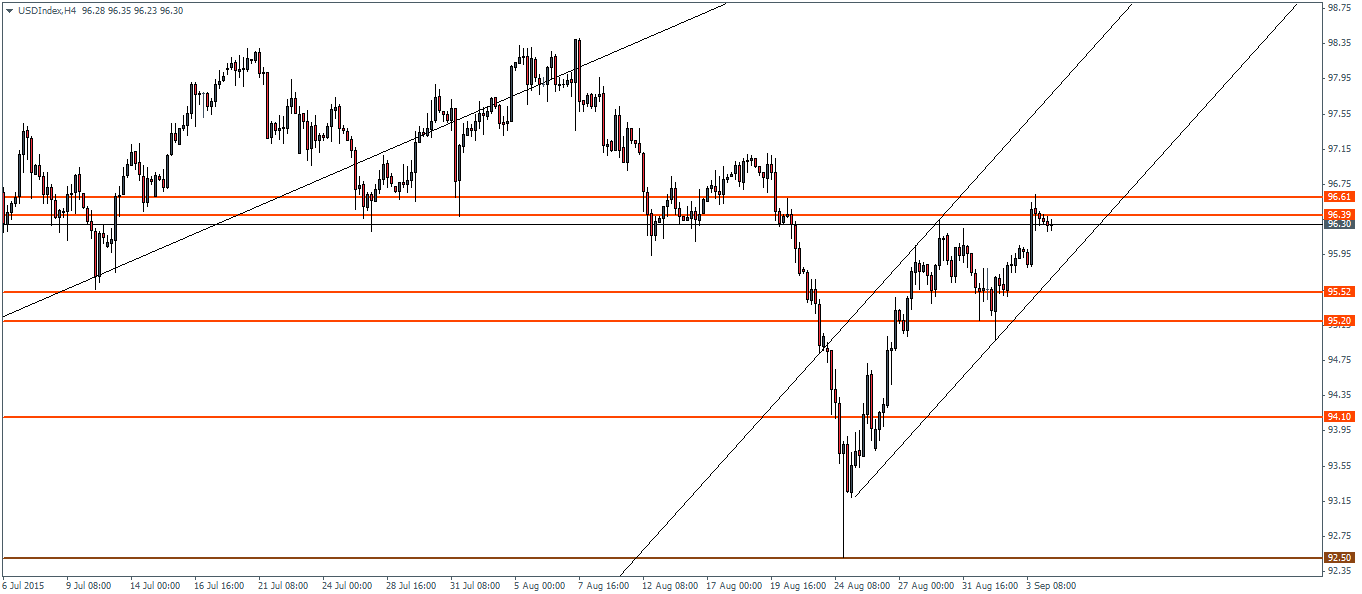
On the H4 chart time frame, we can see that the US Dollar Index is trading near the short term resistance of 96.6 – 96.4 region. Some consolidation between this current resistance, down to 95.5 support could take place ahead of a break out. A clear rally above 96.6 could no doubt see a confluence with the daily charts which will then see the US Dollar Index rally to as far as 98.10. Alternatively, if price breaks the rising price channel, the initial declines could be supported at 95.52 region. Only a close below 95.2 could signal further downside to a test down to 94.10 support.
As noted previously, it is highly possible that the US Dollar Index could either trade above the resistance level of 95.72, or remain range bound or we could see a decline below 95.72 with sideways price action near the 94 level of support. We expect to see a potential test to the 99.5 – 100 level above 97.73 resistance while a test to 93 below94.45 support marks the downside possibility.

