
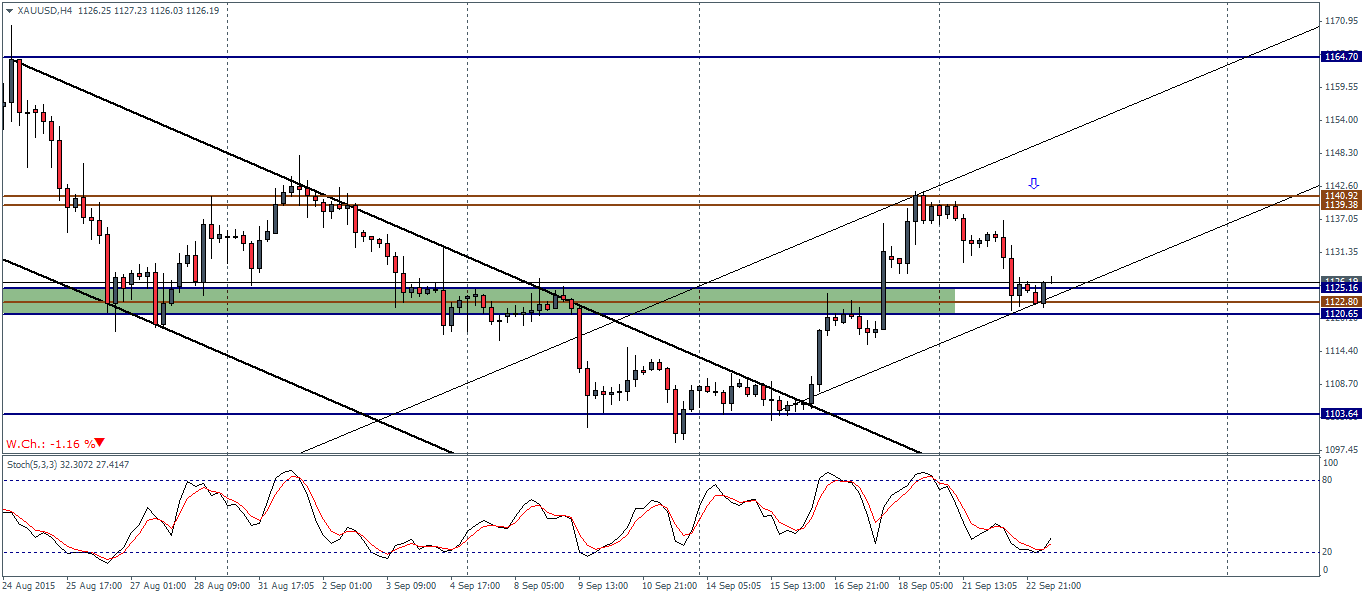
XAUUSD (1126.5): Gold futures are down -1.13% as the precious metal declined broadly this week failing to hold on to the gains from last week. Gold prices fell off the weekly open near 1139.4 to dip to weekly lows at 1122.80, which marks a main support level. The current H4 chart time frame shows a bullish engulfing pattern at this support level and indicates a potential move to the upside. Resistance comes in at 1139 – 1140 region which will prove to be a critical level to watch for. In the event that Gold prices fail to close above 1140 resistance, we could expect another leg down as prices could end up potentially ranging between 1140 and 1120 levels of resistance and support. To the upside, in the event that Gold breaks 1140 resistance, a test to 1160 cannot be ruled out, provided we can see a short term decline to 1140 to establish support on the previously known resistance level. To the downside, a break below 1120 could see Gold prices decline as low as 1100 region which marks a support zone between 1103 – 1100.
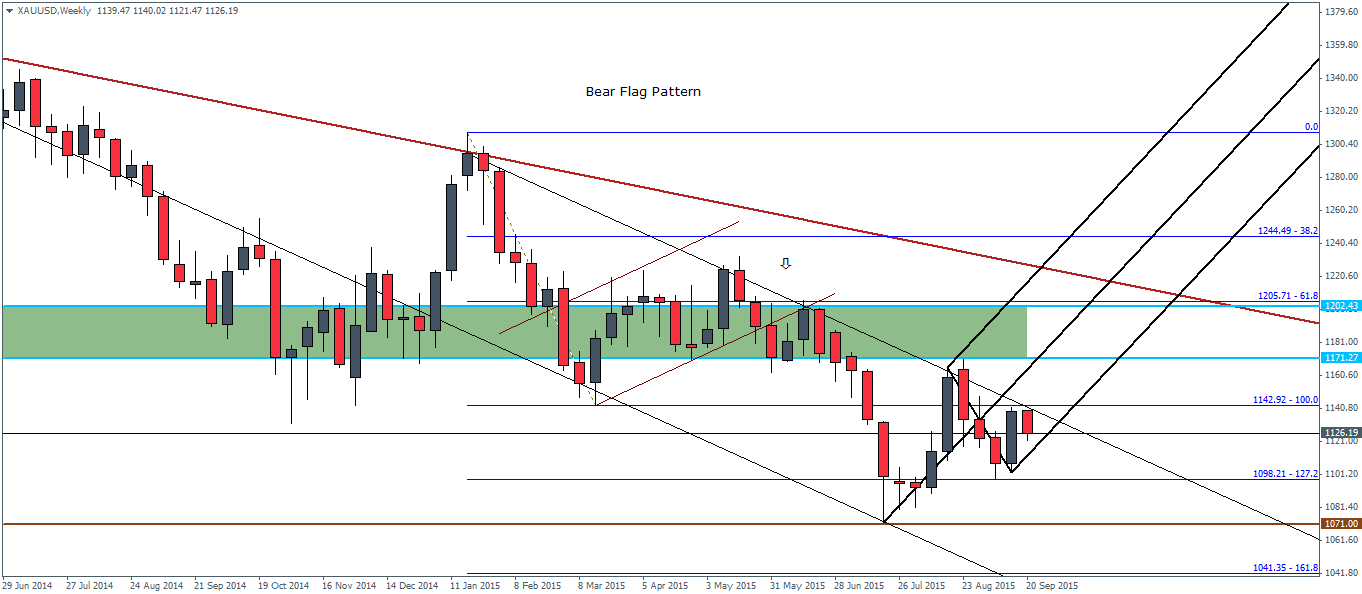
On the weekly charts, after last week closed on a bullish note, prices have so far been subdued. We expect to see this week close in a potential doji candlestick pattern if prices fail to rally above the 1140 resistance. This could in turn prove to be critical going into the next week as traders remain undecided on the short term direction. From the weekly charts, we do know that the bearish flag pattern indicates a continuation to the downside, and thus, a weekly doji candlestick pattern could reinforce a move to the downside where the measured move target of the bear flag pattern sits at 1041. Comparing this view to the above H4 chart analysis, we could therefore look to 1120 level as key as a break below this support could mark a fresh leg of decline in Gold prices.

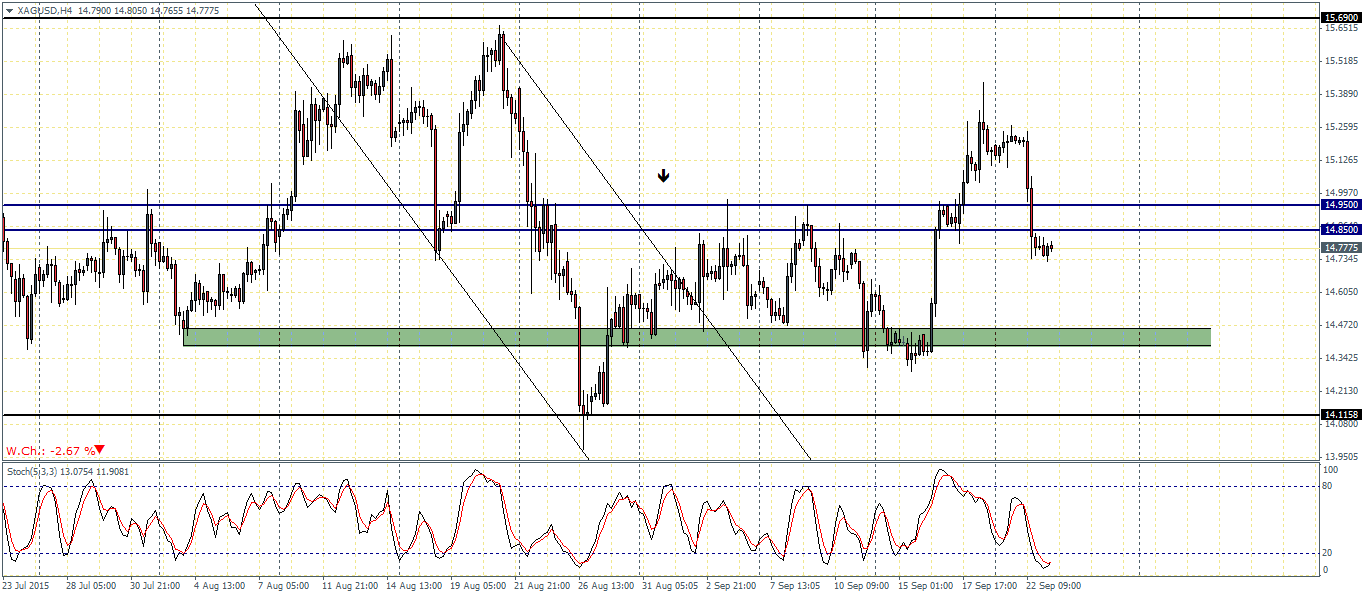
XAGSD (14.77): Silver prices have been bearish this week as fall, declining -2.7% at the time of writing after prices briefly posted a near 3-week high at 15.38 last week. Silver prices declined since the start of this week and have closed below the main support/resistance level of 14.95 – 14.85. A retest to this broken support to establish resistance could confirm the bias to the downside as Silver could potentially fall back to 14.47 level of lower support.
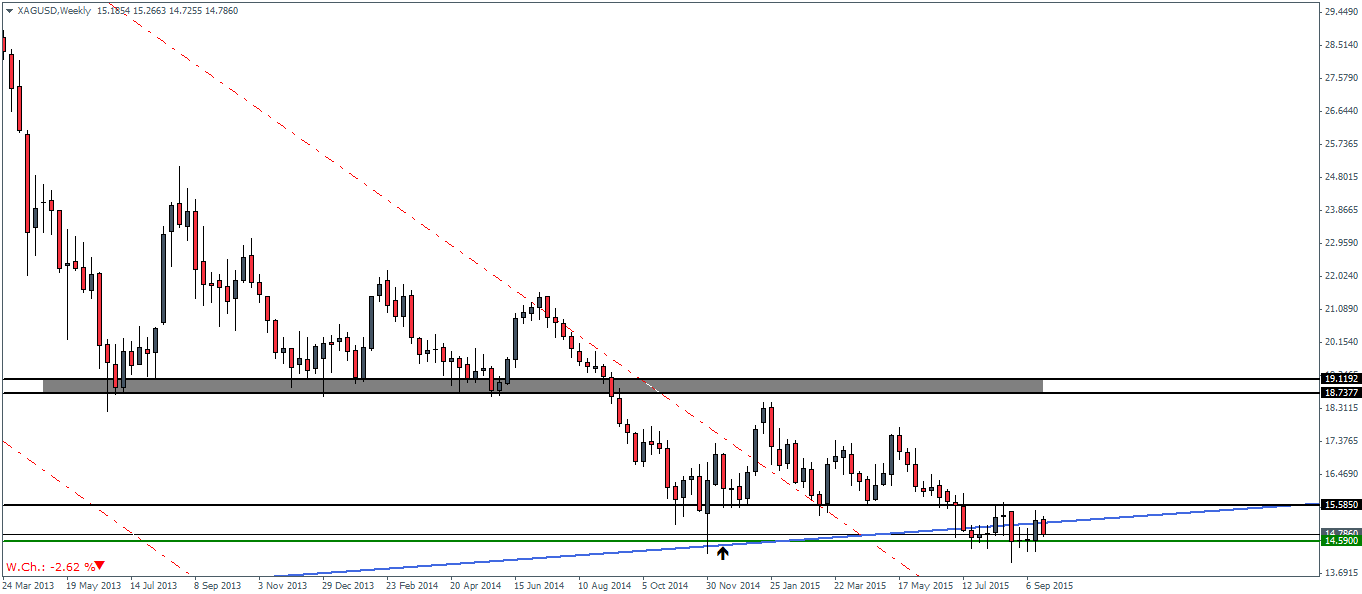
On the weekly chart, Silver prices closed on a bullish note last week coming off the prior two weeks of staying flat. Support on the weekly chart is seen at 14.59 which is where we expect Silver to retest this week or in the coming week. Prices could remain range bound in the medium term between 15.58 resistance and 14.59 support. Only a break out from these support/resistance levels will validate the further bias.
Looking ahead the main risks to the precious metals comes from Janet Yellen’s speech and the final third quarter revised GDP from the US. This week has been especially bearish for the commodity markets as China revealed its declining appetite for commodity raw materials earlier in the week which has led to base metals such as Zinc and Copper falling sharply, while in comparison Gold and Silver managed to hold their ground. In the medium term, Gold is likely to remain range bound as the Fed’s rate hike plans still remain uncertain at this point in time.

