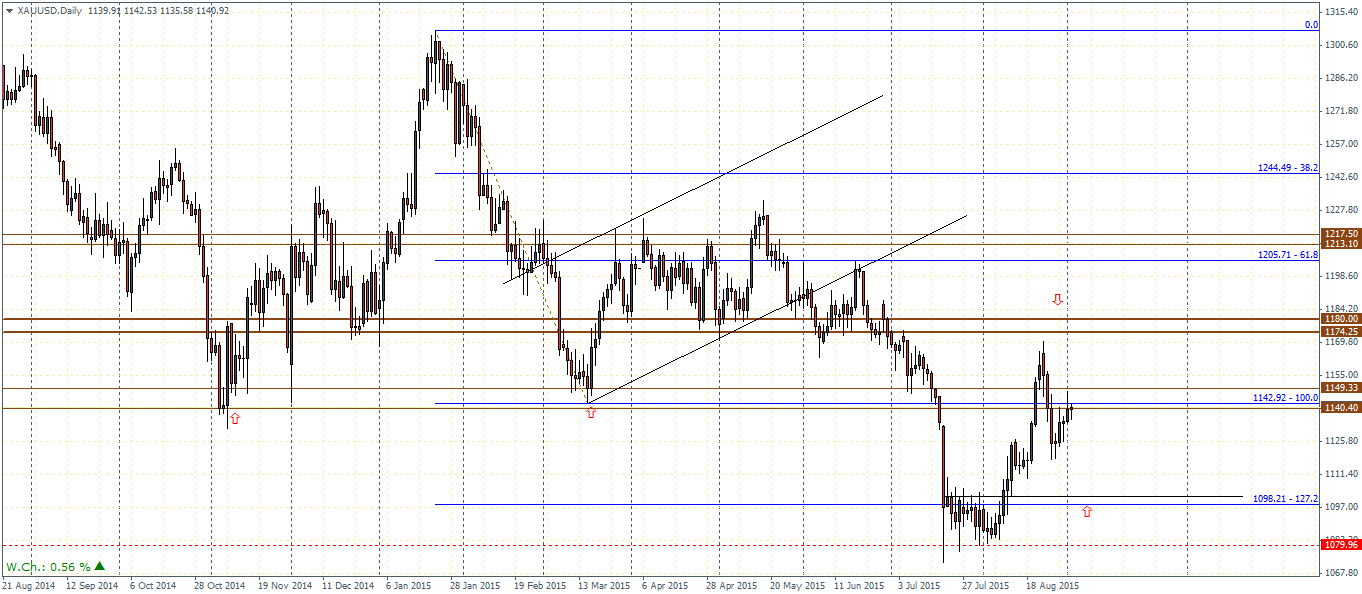
Gold futures have been trending flat for the week despite uncertainty surrounding the global financial markets. Gold futures are up 0.59% for the week and on the daily charts, we notice that the precious metal is trading near a major support/resistance level of 1140 – 1131. Prices briefly attempted to break above this level but the gains were short lived as Gold futures declined back below this level and have since been consolidating near 1140 and 1131.
On the daily charts, plotting the bear flag pattern, we can identify that price action has bounced off the 127.2% Fib level of the bearish flag and has since then trending back to the lower leg of the flag at 1150. This pattern could potentially see Gold prices trading at a critical level. A break above 1150 and establishing support could see Gold futures rise towards 1197 – 1186 level of support and resistance which could potentially invalidate the bear flag and we could expect a medium term consolidation between 1200 and 1150 levels.
On the other hand, if prices decline back below the current resistance of 1140, Gold futures could be well on their way to the 161.8% bear flag’s target zone of 1054 – 1050 region.

On the monthly charts, Gold has formed an inside bar as of August close and we could therefore expect some sideways trading ahead of a potential break out which could occur in either direction. To the upside, the range high of 1175 will need to be broken in order to test the 1200 region, while to the downside a break below 1072 will most likely pave the way for a test down to 1050, the bear flag’s measured move target zone.
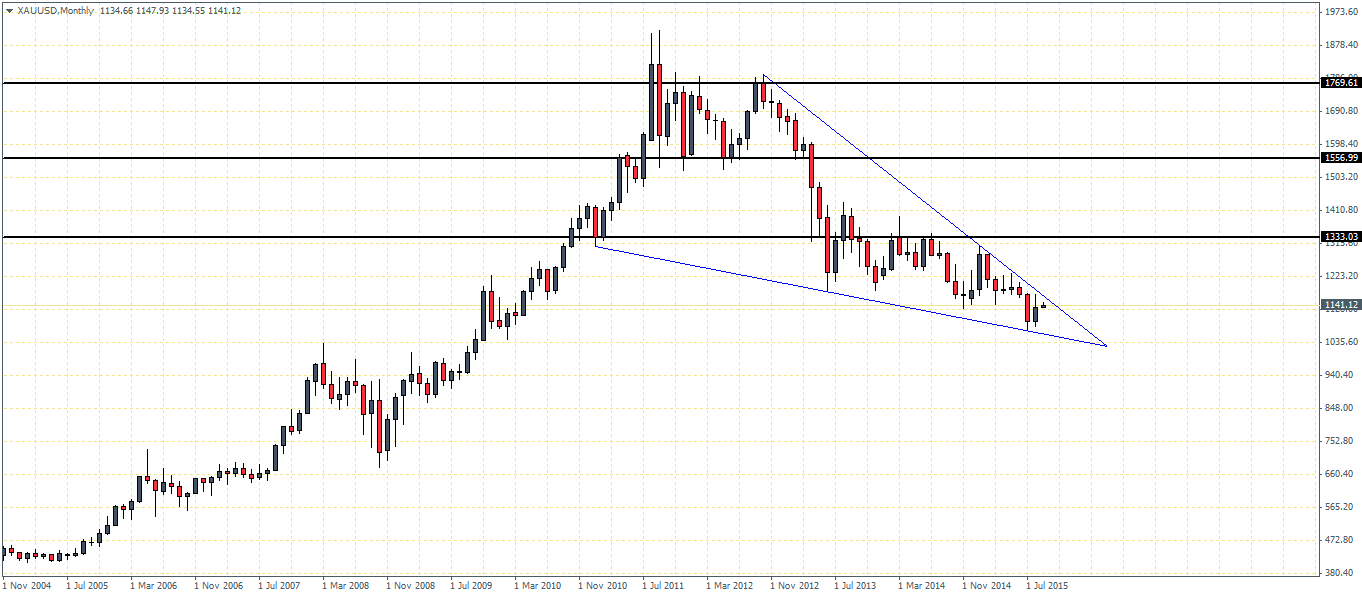
The monthly chart for Gold is also showing a descending triangle/wedge pattern, which is signaling a potential break out to the upside. The most immediate resistance on the monthly charts comes at 1333. Putting into perspective, there is a good chance that Gold prices could fall to as low as 1050 – 1053 levels from which we could expect to see a strong bounce in prices with Gold likely to test as high as 1330 levels.
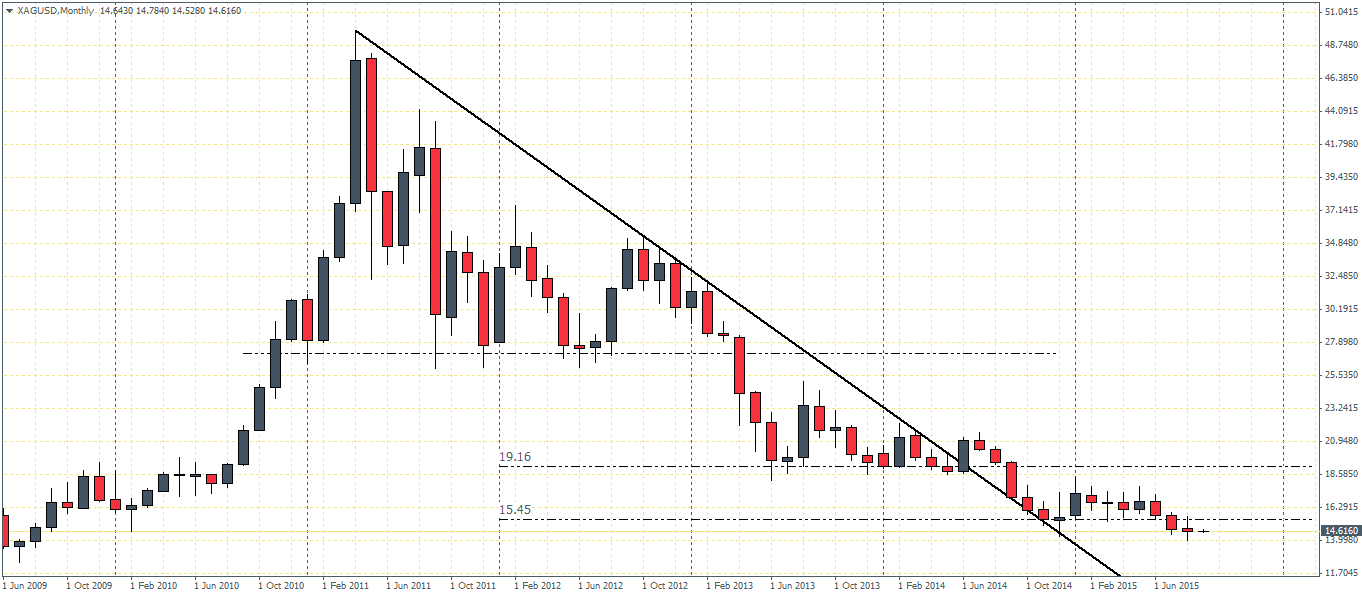
Silver futures have broken down from the monthly consolidation between 19.16 and 15.45 range. The recent break below 15.45 lows has resulted in a small bodied candlestick pattern on the monthly charts which could potentially indicate a temporary exhaustion to the short term declines. We therefore expect to see a possible retest either back to 15.45 or a continued decline to the downside. For the week, Silver is however trading flat for the most part with 0.07% gains at the time of writing.
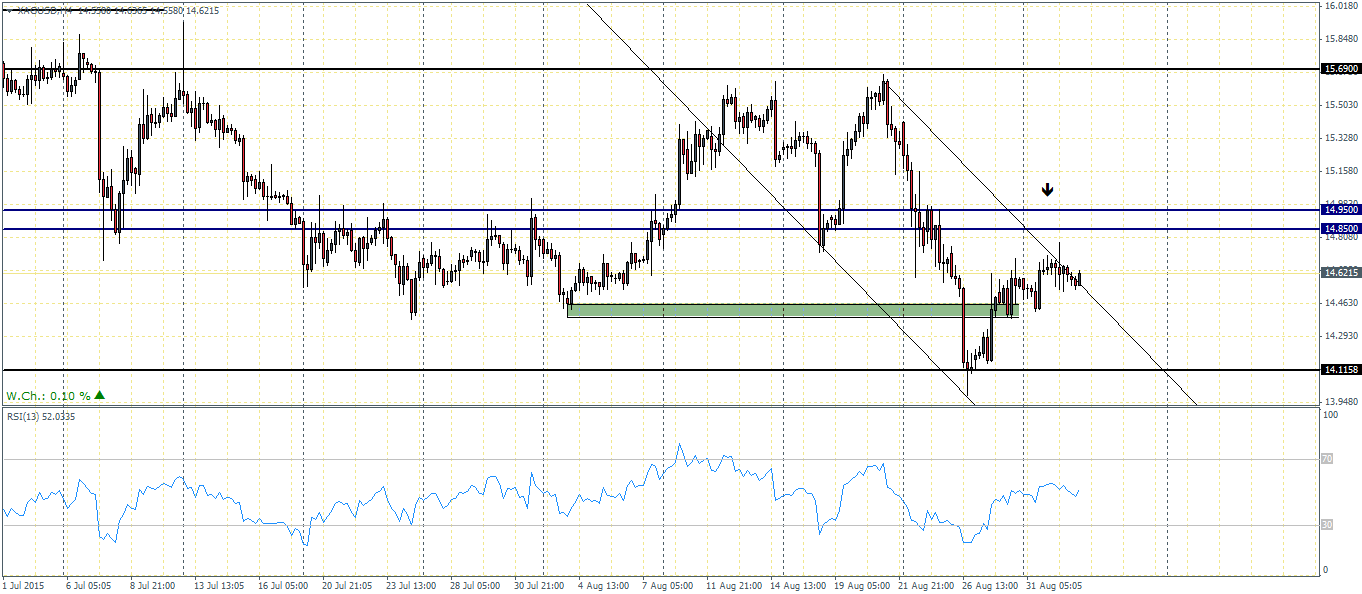
On the H4 chart time frame, Silver has bounced off the short term support at 14.6 – 14.4 region. To the upside, the most immediate resistance level is at 14.95 – 14.85 which is likely to be tested in the near term. This correction also marks a potential end to the bullish divergence to the RSI and we could therefore anticipate a new leg in the declines which could target back the support level and eventually test the previous lows near 14.12.
Fundamentally, the precious metals could most likely come under pressure this week as the US monthly payrolls report is due. The market consensus is inclined to a bullish print for the August jobs report which could potentially see some downside weakness in the precious metals. However, the more important test to the precious metals market comes later in the month when the Federal Reserve meets to decide on whether to hike rates in September or not.

![Credit Card 160×600 [EN]](https://assets.iorbex.com/blog/wp-content/uploads/2023/06/13144507/Blog-Banner_EN-Banner_160X600X2.webp)