Oil (CL_5X)
44.83
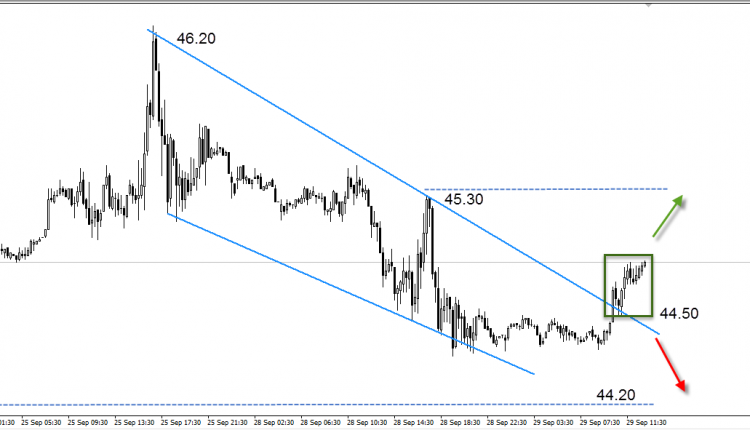
For oil we can expected the coming move as long as the market within the shown triangle (Symmetrical Triangle) That Triangle is shown on yesterday short , however , The shown chart is an analysis for short-time Interval ( 15 minutes Chart. ) . The major upper resistance at 47s and the lower band 44s. So, be neutral till we get more information and breakouts attempts.
Please Note : The shown chart is analysis for short-time Interval ( 15 minutes Chart. ) .
| Support | Resistence | |
| Level 1 | 44.20 | 47.30 |
| Level 2 | 43.80 | 48.20 |
| Level 3 | 42.50 | 49.50 |


![Credit Card 160×600 [EN]](https://assets.iorbex.com/blog/wp-content/uploads/2023/06/13144507/Blog-Banner_EN-Banner_160X600X2.webp)