
Gold futures have been particularly rough over this week despite a promising rally late last week. Gold gave up all of its gains and is down -1.73% for the week. On a broader perspective, there is a scope for a Gold rally above 1122/1125 support, which could see a rally towards 1150 resistance and eventually to 1180. Alternatively, if prices fall below 1122/1125 Gold could turn bearish with the downside target towards 1110 and eventually to the 1000 region of support. The commodities on the whole have been under pressure since last week as reduced global demand for raw materials has led the commodity markets fall sharply. The decline in prices have also rubbed off into the equity markets as mining shares dived over the week across various equity markets.
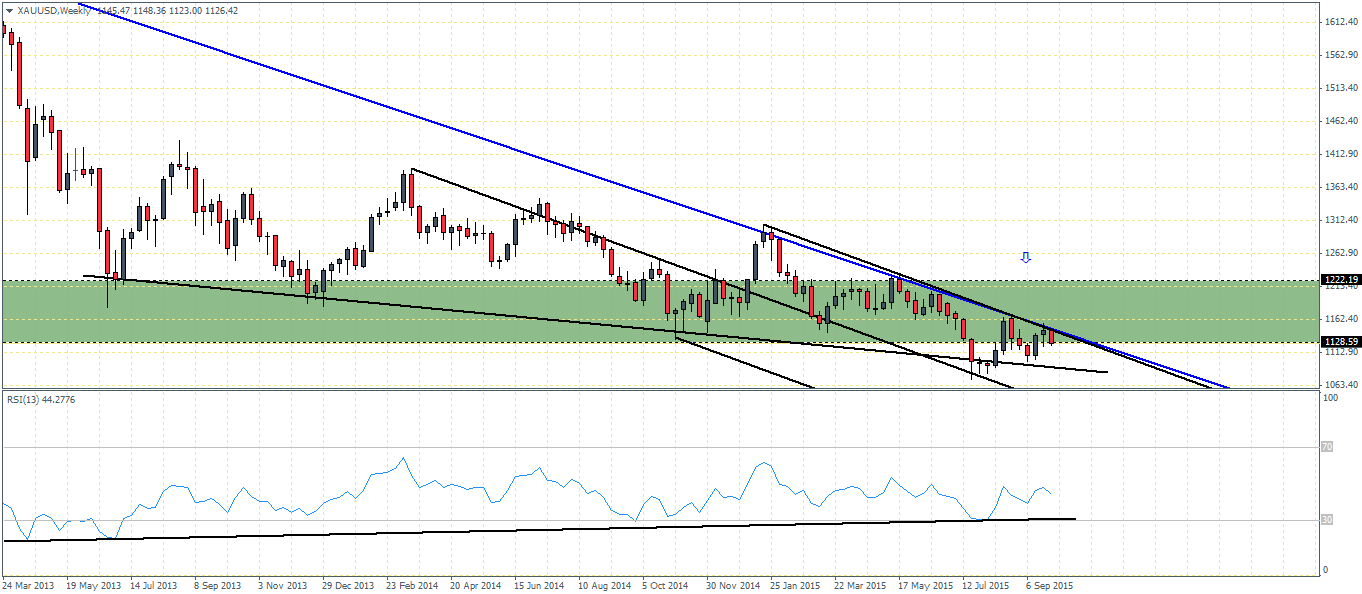
On the weekly charts, Gold is currently posting a bearish candlestick which comes after previous week’s small bodied spinning top candlestick pattern. A close above last week’s high of 1156 or at the very least, last week’s close of 1146.26 is needed to keep any bullish views intact. On the weekly chart below we also notice the bullish divergence that has been formed which indicates a longer term rally to as much as 1200 and 1222 region. Therefore, if prices fail to close above 1146/1156 region on the weekly charts, we could expect prices to trade in the range. A close below 1100 could however see a potential decline where Gold could post a new low.
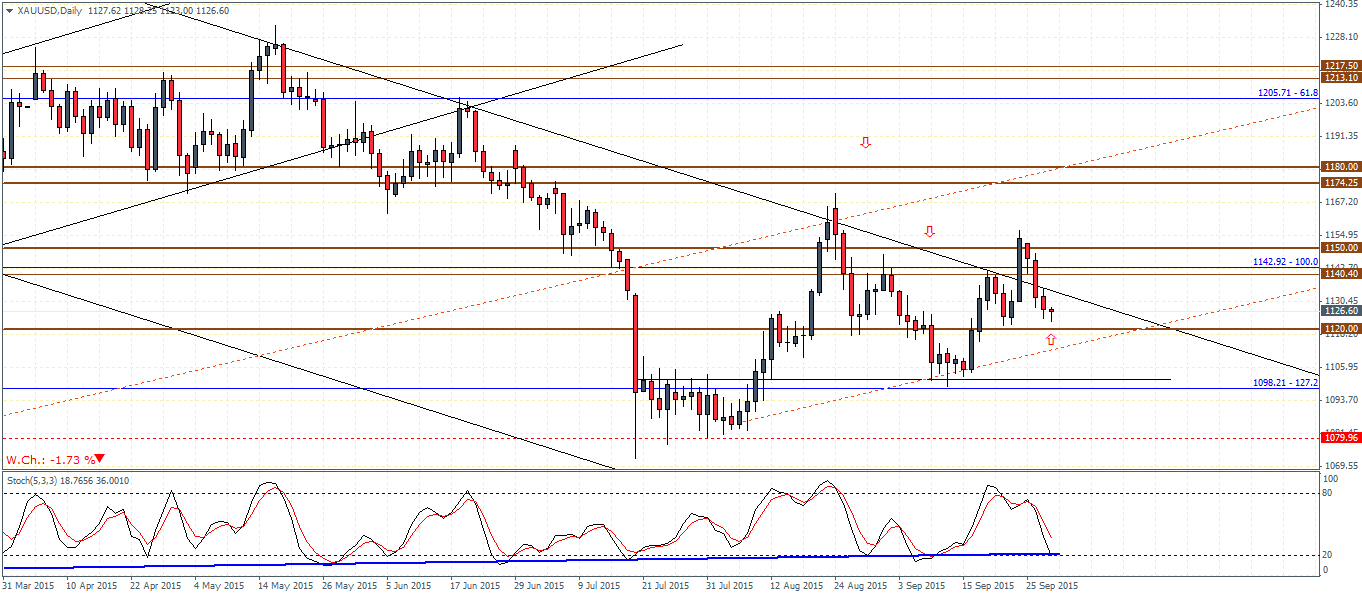
On the daily chart for Gold, we notice that prices are trading outside the rising median line. However, as long as prices are above 1122/1125 there is scope for a rally. Prices are currently attempting to breakout from the major falling price channel. Applying the Stochastics oscillator, we notice a bit of a hidden bullish divergence being formed, which still supports the upside bias which can be confirmed on a close above 1150.

Silver futures have fallen -2.96% on a weekly basis and the candlestick pattern on the Silver chart is looking very bearish. A lower close this week below 14.59 support could confirm this view as we can anticipate a new leg in the decline upon confirmation.
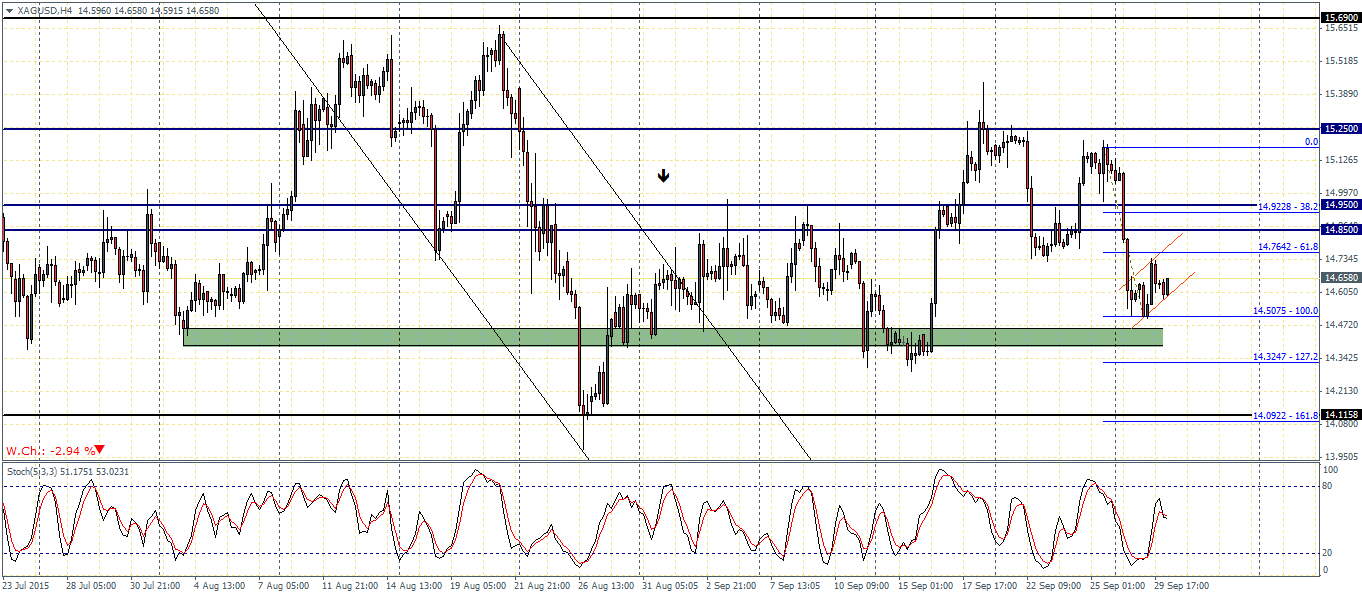
On the 4-hour chart time frame, Silver futures remain range bound with prices bouncing off the lower support near 14.47/14.5 and the resistance at 15.25. On the H4 charts, we can see that a break below 14.47/14.5 could see Silver being support near 14.11 support. There is also a potential bearish flag pattern taking shape right above the support at 14.5 region. A successful break out could see Silver decline to 14, which shows confluence with the support level that was identified at 14.11.
In terms of economic data as a catalyst, the US ADP private payrolls data is due today while the all important monthly Nonfarm payrolls data is due for release this Friday. Later tonight, Fed Chair, Janet Yellen is expected to deliver a speech and it is likely that the optimistic/hawkish narrative will be the prevailing theme.

![Credit Card 160×600 [EN]](https://assets.iorbex.com/blog/wp-content/uploads/2023/06/13144507/Blog-Banner_EN-Banner_160X600X2.webp)