
EIA revises down 2015, 2016 Crude Oil prices. Weekly inventory report due today!
Crude oil futures have been trading lower for the week, losing over -3.3% after a brief rally towards $46.3 which was unsuccessful. At the time of writing, Crude oil is trading near the weekly lows of 43.37 in an attempt to recover some of the losses. The weakness in Crude Oil comes amid continuing signs of production oversupply. Furthermore, the EIA revised down its crude oil price forecasts for the year. The US Department of Energy Information Administration said yesterday that it forecasts Crude Oil prices to average to around $49.23 a barrel in 2015, down from $49.62 as previously estimated. For the next year 2016, the EIA expects Crude oil to average $53.57 from previous estimates of $54.40.
For the year Crude oil prices have declined close to 17% with no signs of slowdown from the production sector as global demand for Crude oil continues to fall in light of a slowdown from China and other major economies with the exception of the US.
The weekly Crude oil inventories report is due today with the median forecasts expecting to see a modest buildup in inventories by 0.9 million barrels, slightly lower from 4.7 million barrels from the previous week.

Crude Oil Technical Analysis
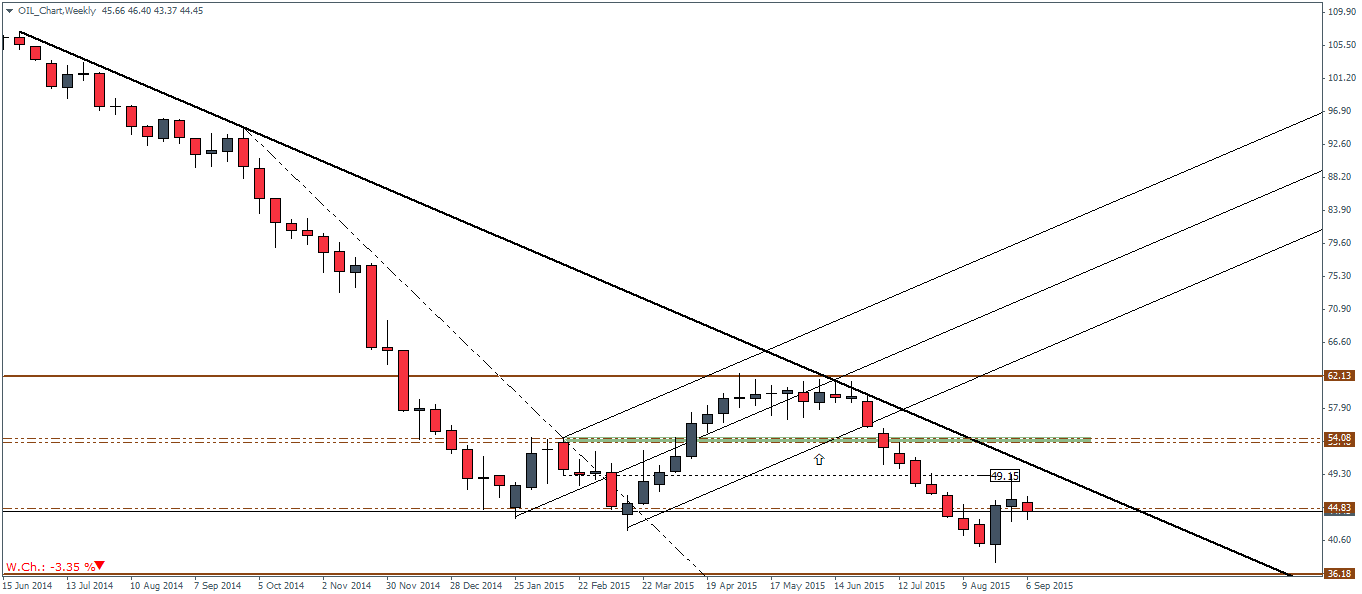
On the weekly chart for Crude Oil, prices have managed to post two weeks of gains after a sustained decline from the high of 61.81 in June this year. Crude Oil futures managed to recover off the lows of 37.76 in the week of 23rd August to test the highs of 49.15. On the weekly charts, price action is trading close to the support/resistance level of 44.83. A weekly bearish close here could spell a new leg of declines in Crude oil for the coming weeks, while to the upside a weekly close above 44.83 could offer some hope for the bulls as a potential rally to test the highs of $54 could be seen as a possibility.
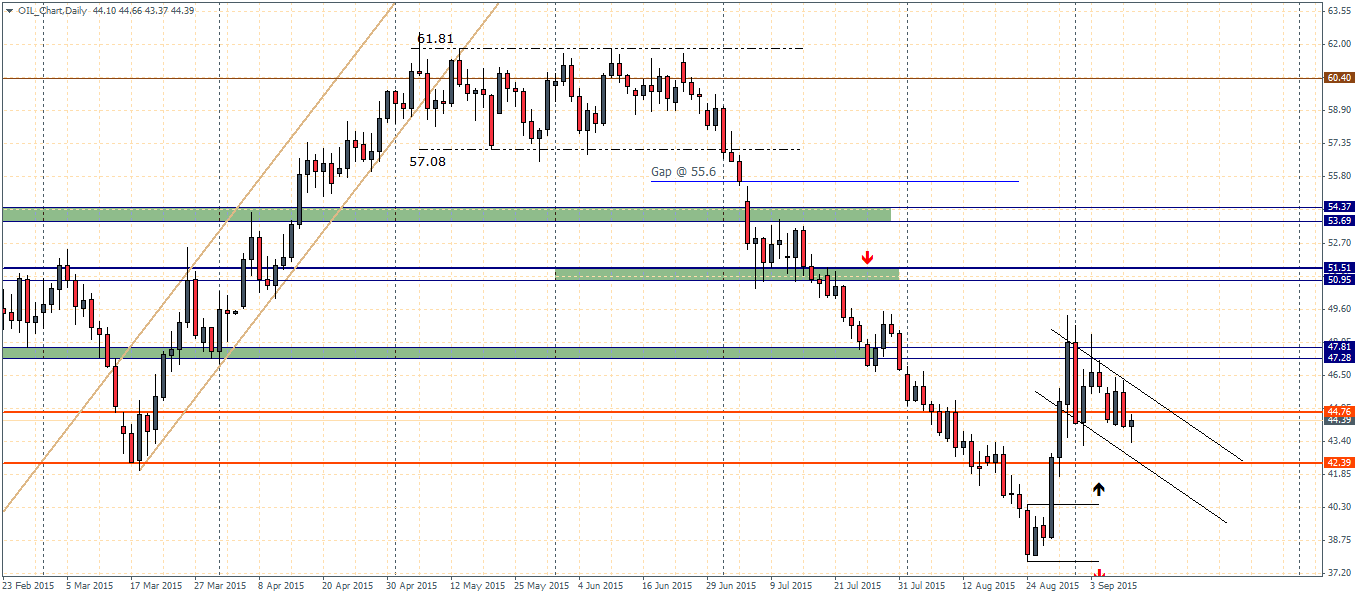
On the daily charts, last week we noted that a break above 40.43 would signal a rally and price action worked out as expected testing the previous broken support near 47.81 – 47.28 before pushing lower. Price action is back to the major support/resistance level but it is also forming a possible bullish flag patter on the daily charts. A break out would validate this view with the potential to target the next three main levels at 47.81 – 47.28 followed by 51.51 – 50.95 an eventually to 54.37 – 53.69. The bullish view would however be invalidated should we see prices close below $42.39 on the daily charts.
Besides today’s EIA Crude oil inventory report, other major economic releases this week include the US producer price index due tomorrow. The main event of course will be the Fed’s FOMC meeting due on 17th September which could bring significant volatility to the US Dollar index which could in turn affect the prices of Crude oil at least in the near term. However, on the same note, a tightening of the US Fed funds rate would potentially signal a confirmation of the growth in the US economy which should offer some hope for continued demand for Crude oil from the world’s largest economy.

![Credit Card 160×600 [EN]](https://assets.iorbex.com/blog/wp-content/uploads/2023/06/13144507/Blog-Banner_EN-Banner_160X600X2.webp)