The slump in the commodity prices since last week has started to push the commodity risk currencies lower. The most affected were the Australian and the Kiwi Dollars both of which have lost -0.57% and -0.47% on the daily basis while on a week to date basis, the risk currencies are down -1.24% and -0.83% respectively.
Among the most hit was the base metals as Iron Ore, Copper started their descent last week. While Gold managed to hold steady and posting a rally last week, prices failed to capitalize on the gains and started declining since last Friday. At the time of writing, Gold is down -1.62% for the week. The biggest casualty of the commodity price declines were mining stocks. Glencore, a UK listed company has been the worst hit with expectations that the continued slump in commodity prices could potentially bankrupt the company. Besides Glencore a number of UK mining shares were also dragged lower in both the FTSE100 and the German DAX, which has already been hit by the Volkswagen scandal. The equity markets were therefore trending lower across the board including the Nikkei 225 and the US Dow Jones and the S&P500 Index. The rub off into the currency markets has seen the Yen surging across the board while the risk currencies being the hardest hit.
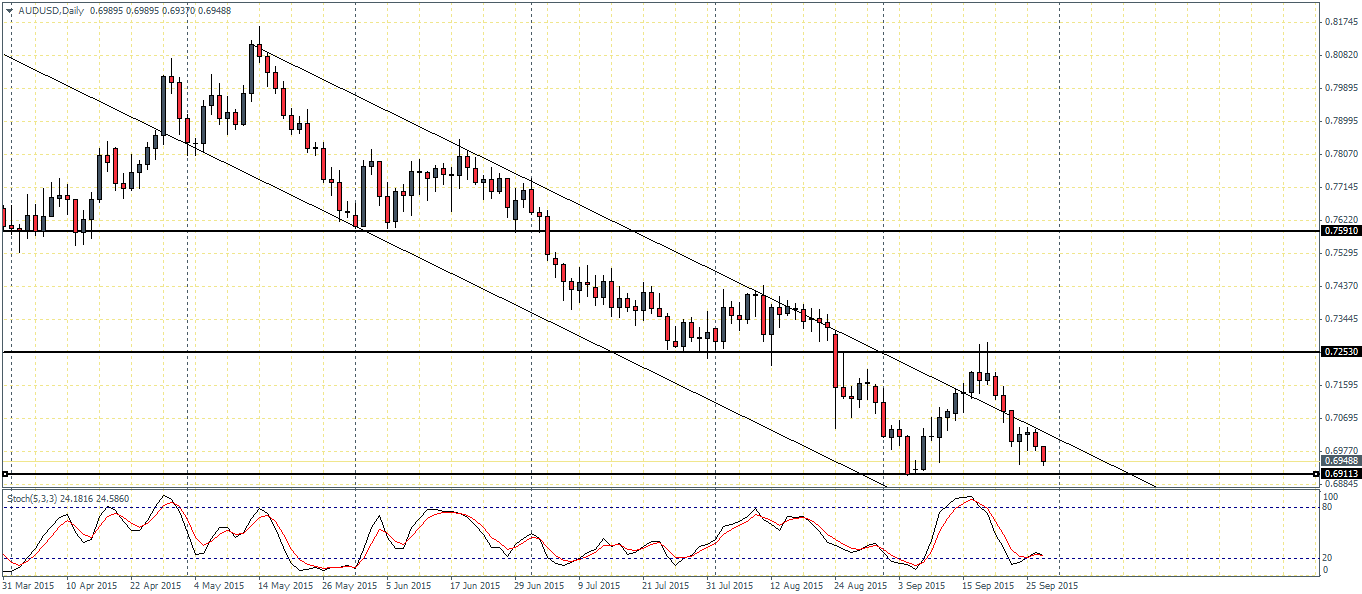
The Aussie is trading below the 0.695 marking the lows near 2008. The two week rally seen between 6th and 13th September failed to offer any support as AUDUSD reversed its gains near 0.7 handle and turned lower.
On the daily charts, immediate support in AUDUSD comes in at 0.6911 region which saw prices bounce off sharply around the 4th of September. If support holds prices in this second attempt we could expect to see another short squeeze that could push the Aussie higher to recover some of the declines. Comparing to the Stochastics oscillator and the falling price channel we notice that the Stochastics is currently posting a modest higher low. Taking this in combination with the support at 0.6911 we could therefore expect a potential bounce to the upside. Resistance comes in at 0.7253 which was briefly tested on the 17th of September but prices were rejected sharply but there is no ruling out for a recovery that could test this resistance level with closing prices rather than the highs.

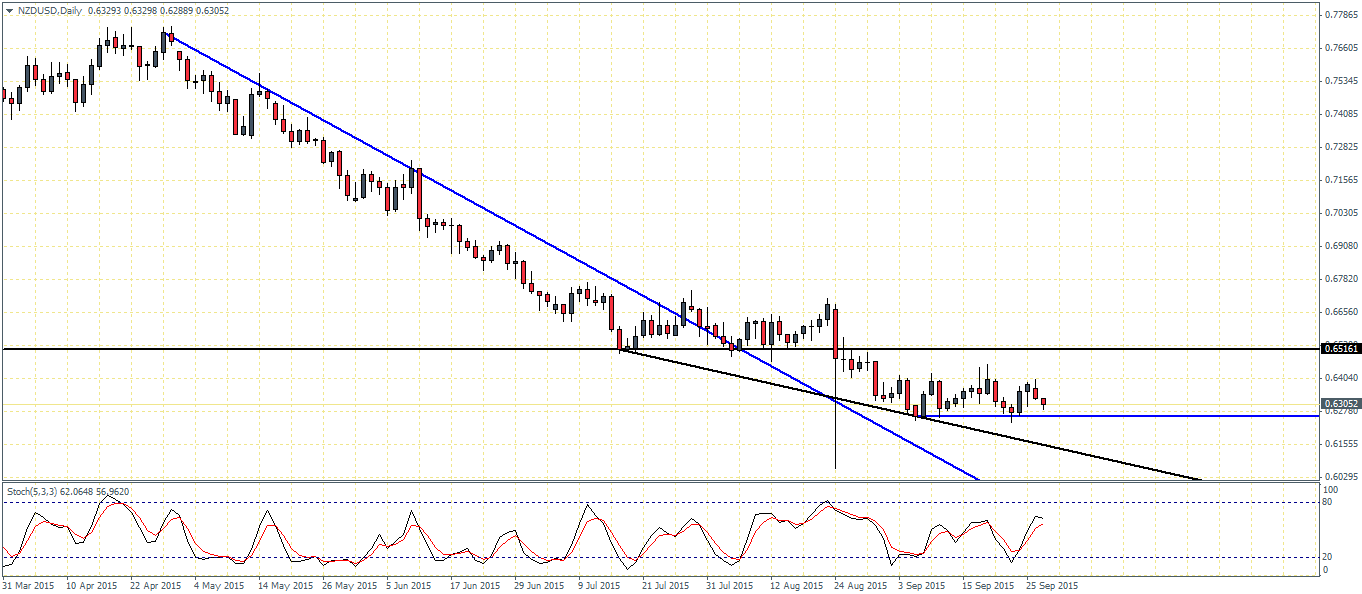
For NZDUSD, the sharp downtrend remains in place but prices are trading near the short term support at 0.6260 region. A test of support here could possibly offer a short term recovery in NZDUSD as well. While the Stochastics has not confirmed any clear signal of a bullish divergence, any bounces off 0.626 could see NZDUSD post a recovery to as much as 0.6516 level of resistance, which again could be tested with closing prices. A break below 0.626 support will see prices reacting to the dynamic support of the trend line.