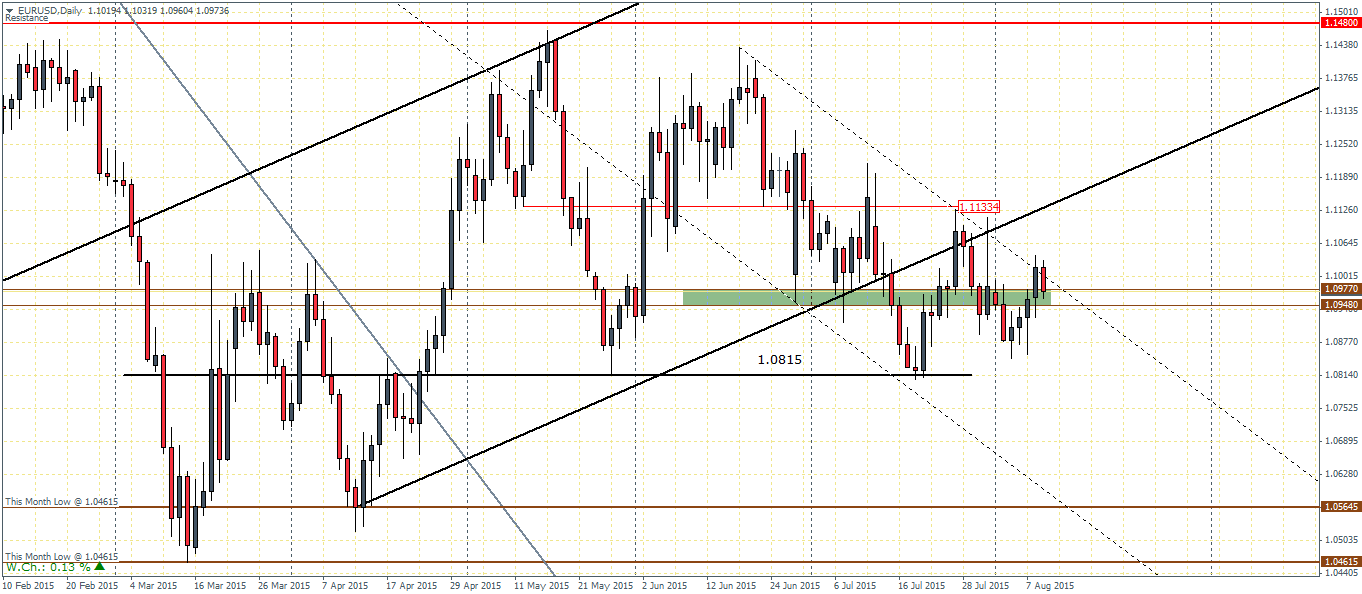
EURUSD (1.09): EURUSD has been consolidating near the 1.09 – 1.095 level of support and resistance for close to 25 daily sessions. Price action has been stuck in a range within the falling price channel after the break out from the major rising price channel. At the time of writing, we have seen a retest back to the rising price channel and this could point to a potential move to the downside. However, the support at 1.0977 through 1.095 will need to be cleared, preferably with a strong momentum in order to ascertain the next leg in the decline towards 1.0815 and eventually to 1.05645. Alternatively, if the support manages to hold the declines, EURUSD could look towards a rally to the upside while struggling to break the previous short term resistance at 1.1133 which could see the currency head back into the rising price channel.
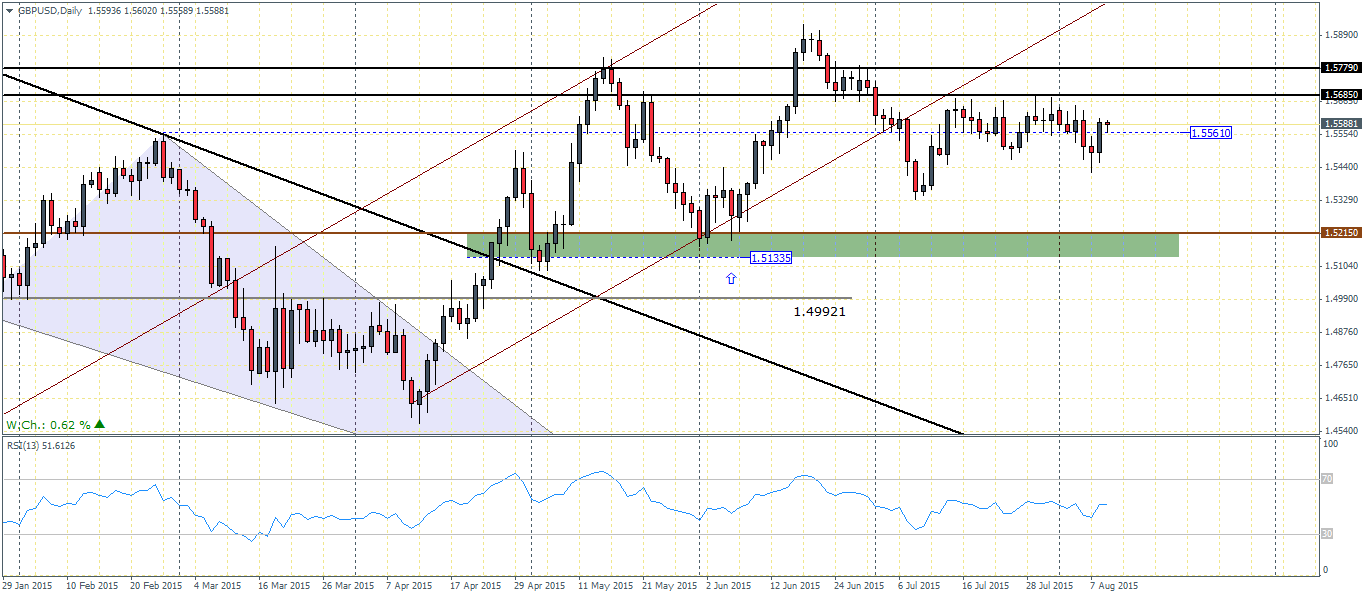
GBPUSD (1.55): GBPUSD has been mostly flat for the past 20 daily sessions and has been stuck between the range of 1.566 through 1.544 with no clear bias. There is a major resistance overhead at 1.5779 through 1.5685, which will very likely contain the rally. However, a break to the upside above 1.5779 will no doubt see GBPUSD test new highs. To the downside, which looks more probable, the Cable could see a test down to 1.5215 region of support, which could be the next area of interest where prices could consolidate ahead either declining down to 1.50 or trade within the major support and resistance levels of 1.57 and 1.52.

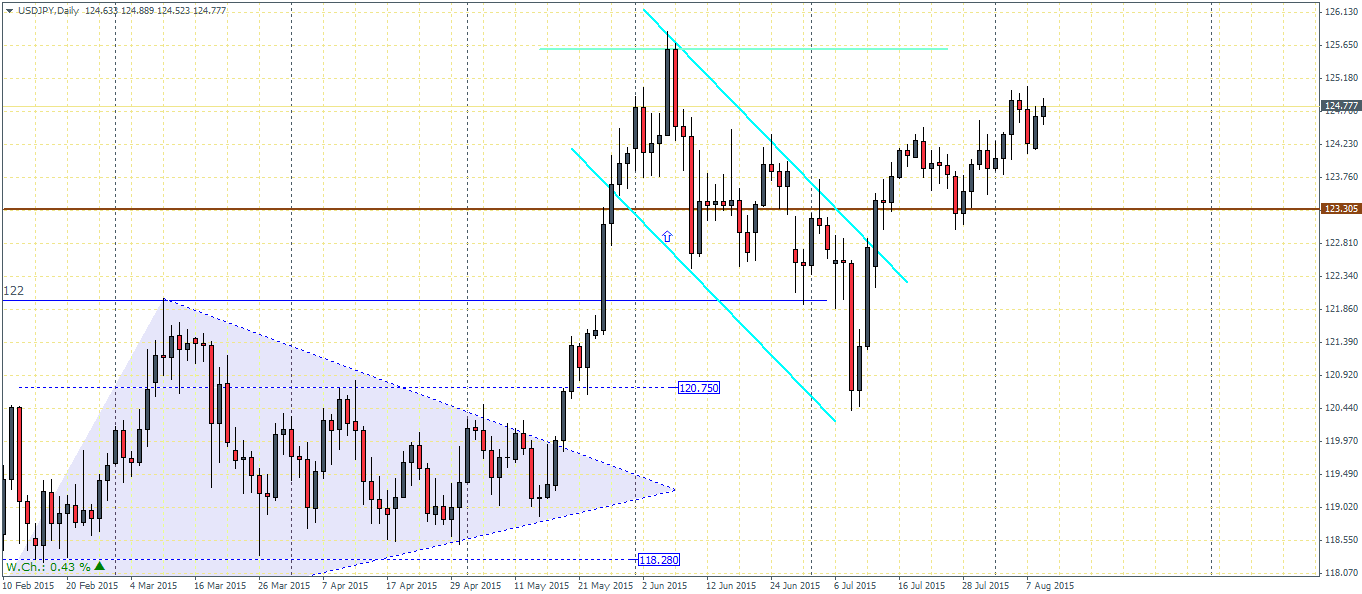
USDJPY (124.8): USDJPY is struggling to break above the 125 round number level after prices bounced off the 123.3 support. Minor support comes in at previous lower highs at 124.23 which if supports prices could push USDJPY higher towards 125.60. The major bull flag continues to remain in play as long as the support at 123.3 contains the declines. There is also a possibility of further upside on break of 125.65, but current price action dictates that the move to 125.65 is likely to be very gradual.
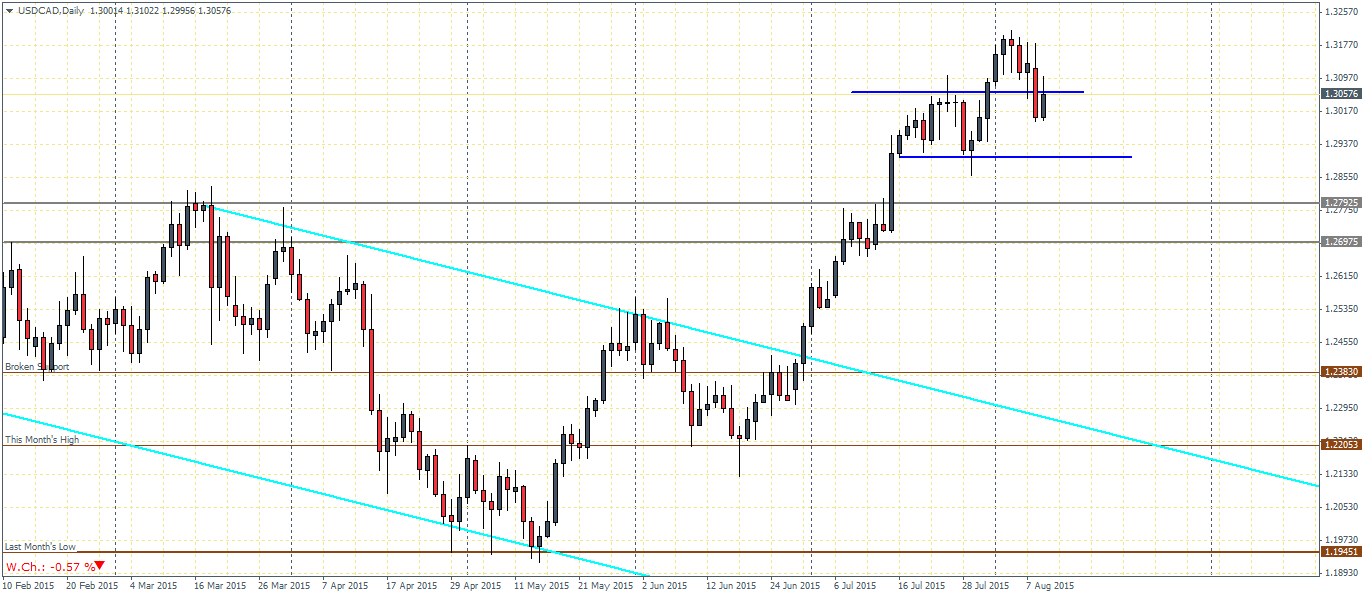
USDCAD (1.30): USDCAD broke free of the range near 1.306 and 1.29 and briefly tested the highs above 1.317. However, this move to the upside was short lived as prices are back trading within the range. The consolidation is likely to see another test back to the 1.30 – 1.29 level of support on the lower end of the range. A break below 1.29 will send USDCAD to test the previous support that sits between 1.279 through 1.26975. This could make for a strong level of support that could see USDCAD attempt to rally higher, subject to the ability to break the current support and resistance levels formed due to the consolidation.
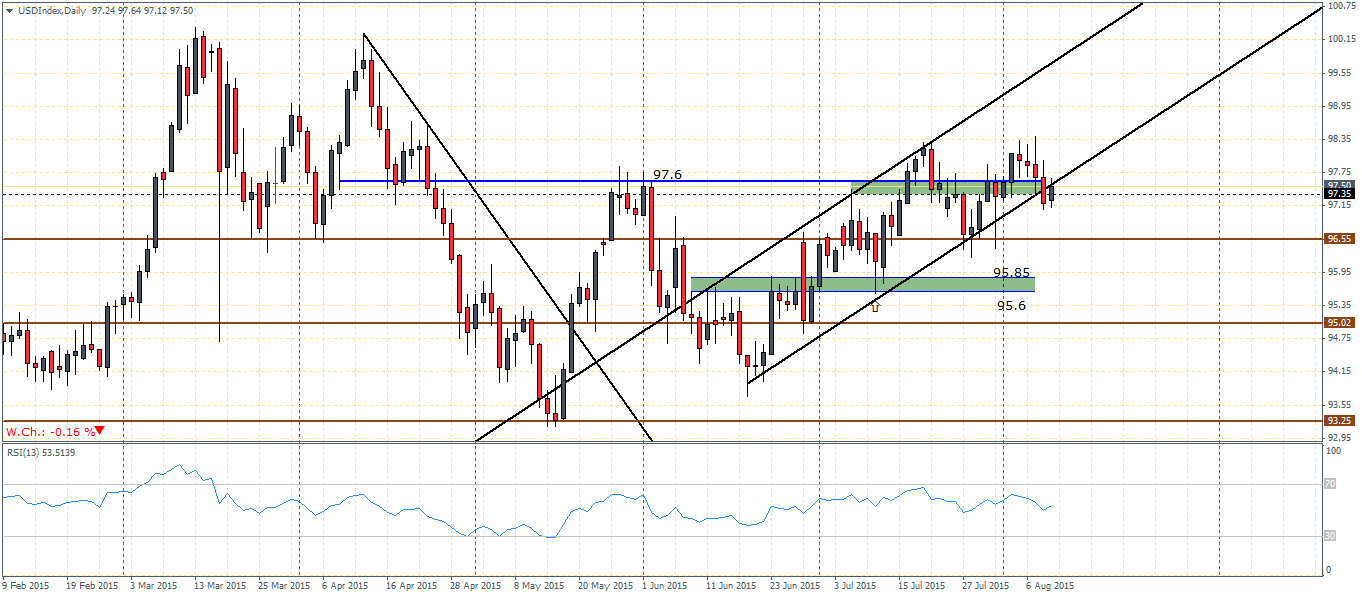
US Dollar Index (97.5): The US Dollar Index has yet again formed strong resistance near 98.35 which has failed to give way for more rallies in the index. Price action is currently consolidating near the short term support/resistance region between 97.6 through 97.35. A successful cap on rallies at this level, combined with the break out from the rising price channel could see the US Dollar Index test the lower support at 96.55 and eventually to the next major support at 95.85 through 95.6. Price action in the US Dollar Index from here on will be interesting as we can expect some kind of consolidation to take place within the 95.85 – 95.6 region and the 95 level of lower support.