
The US Dollar Index has turned weaker this week losing -1.1% at the time of writing. The Greenback opened the week at 96.56 and tested the highs to 97.10 before giving back its gains to trade lower marking a second straight week of losses. The main events this week which shifted the market sentiment to a bearish US Dollar was the FOMC meeting minutes which the markets viewed as being dovish raising doubts on whether the Fed will be able to hike rates in its September meeting.
The main theme off the FOMC July meeting minutes was the fact that member’s were not confident about inflation returning to the Fed’s target rate of 2%. Inflation has been stubbornly low for the past 38 straight months. In a bid to offset the risks of lower inflation, Fed members wanted to see further improvements in the jobs market. As of now, the Fed has managed to achieve only one of its mandates which is to ensure maximum employment.
However, all is not lost as the markets will see another CPI report and the August jobs report ahead of the key decision making FOMC event in September. Economic data in the US has been largely mixed and has done little to boost investor confidence.
US Dollar – Technical Analysis

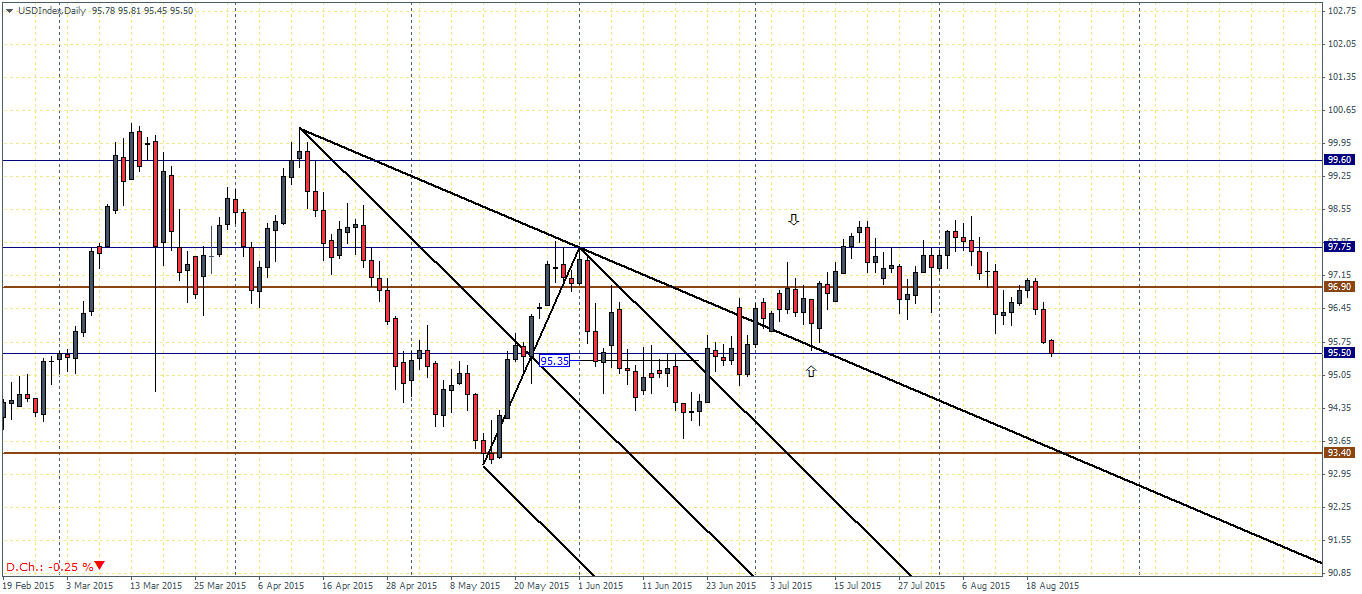
On the technical front the US Dollar Index after testing the support/resistance near 97 fell back to the identified support at 95.50. A break below 95.50 could see a sharp decline down to the next major support at 93.40. We could however expect to see some bounce off the current support near 95.50 and a break of this support could be expected sometime next week if the daily close manages to settle back above the 95.50 handle.
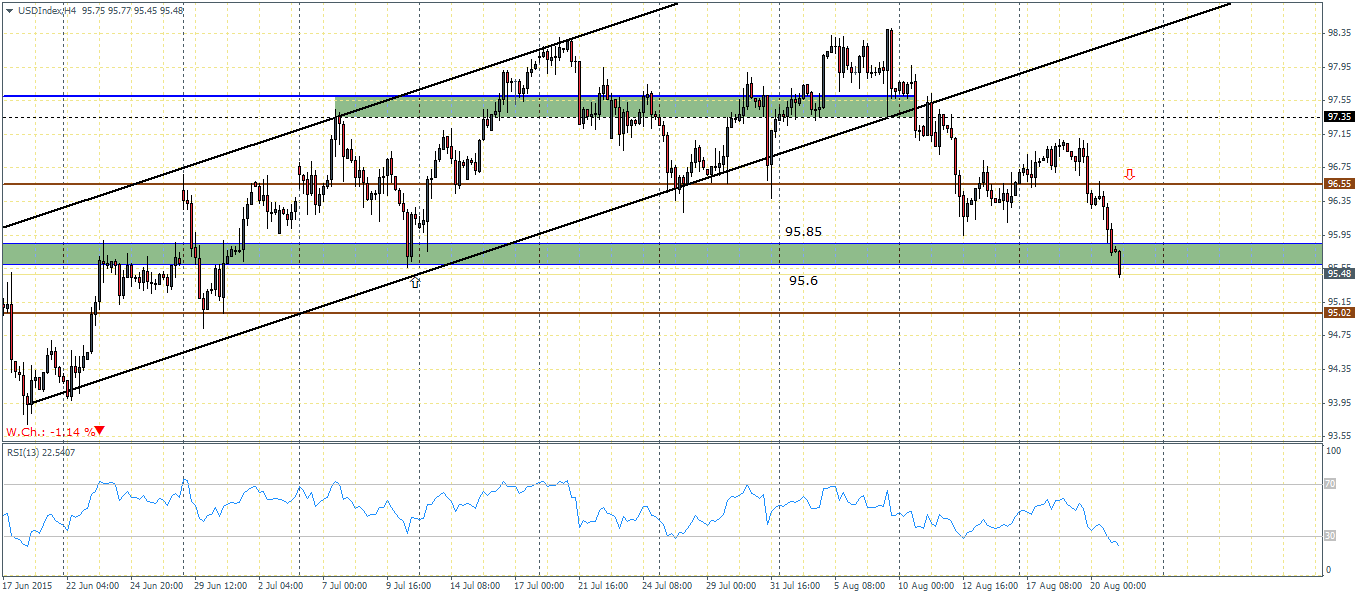
On the 4-hour chart for the US Dollar Index, the price action is more evidenced as price currently trades near the major support/resistance level of 95.85 – 95.6. Below this key level comes a major support at 95.02, which could be tested in the near term. However, a test back to 96.55 to establish resistance will give a clear indication of a possible big move to the downside in the near to medium term.
In terms of the economic data for the near term, the next main risk comes from the second GDP estimates due next Thursday, 27th of August. While the US economy has been growing moderately it still lacks the momentum that could support the Fed’s interest rate hikes and the economic data so far has been mixed; positive, but nothing spectacular to talk home about. In this aspect the uncertainty is starting to take its toll on the markets as investors are starting to shed their positions in the US Dollar Index in the likelihood of a delay to the Fed’s rate hike. If the September rate hike is missed, the next rate hike could be either in October or December.

