
The US Dollar has managed to gradually trade higher earlier in the week but the consolidation seen is most likely a holding pattern ahead of today’s all important unemployment report. Technically, the US Dollar Index has managed to stay above the support zone near 97.75 through 97.45 region. If this support level manages to hold prices, the Dollar index could most probably see a test to the next major resistance near 100 through 99.50.
Price action however is a bit concerning as it is trading outside of the median line and has failed to break above the previous highs of 98.25 and so far only testing these highs once. In the daily chart below we have plotted a new minor median line within the previous ‘Gray’ median line. This clearly points us to the support zone mentioned earlier, as well as the upper ranges of previous high.
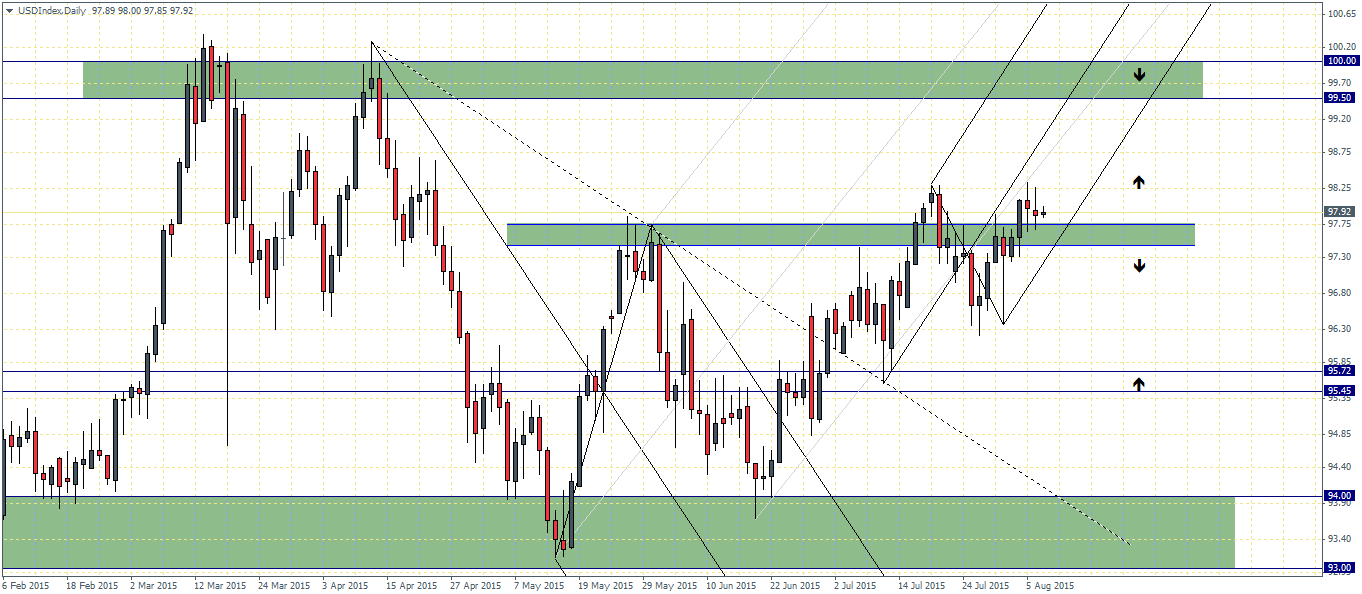
Thus, the US Dollar will most likely set the stage for the future course of action probably after today’s NFP release. The risks to the downside comes on break of support at 97.75 – 97.45. This will open the way for a deeper decline to 96.3 and potentially to the next main lower support near 95.72 through 95.45.

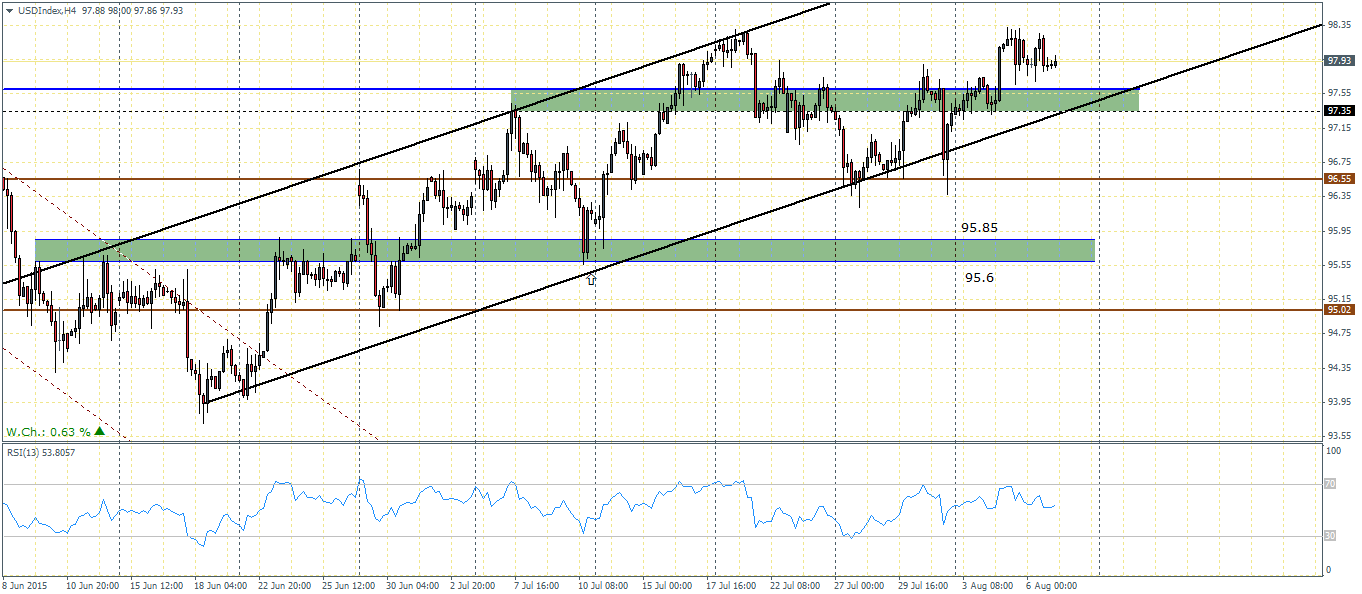
On the 4-hour chart time frame, there is a minor bearish divergence to the RSI building up as the RSI oscillator is failing to confirm the currency highs in price. However, with prices well supported above the short term resistance zone above 97.75, we could expect a possible test to the downside support before rallying. It will only take a break of the support zone and a potential break out of price to the downside from the rising price channel to ascertain a bearish view. In the event of a downside break out in the US Dollar index, we can expect the next minor support level at 96.55 to contain the decline. Below 96.55 comes the next major support at 95.85 through 95.6
Looking ahead, on the fundamental basis, today’s non-farm payroll report will be the first of the two jobs report that FOMC will be assessing ahead of the September rate hike decision. The Fed had previously indicated to the markets that some improvement was needed in the labour markets for the Federal Reserve to hike rates. Currently, the US unemployment rate stands at 5.3% and going into today’s NFP release, the market estimates the unemployment rate to stay put at 5.3%, while seeking modest growth of 222k new jobs being added to the economy in July. Recent ADP private payrolls disappointed adding only 185k jobs and this disappointing number is likely to weigh in on investors. A disappointing print is no doubt going to see a sharp reaction in the markets which could put the US Dollar under strong selling pressure. Also, last week the employment cost Index grew at a very slow pace of 0.2%, which wasn’t a very encouraging number. Therefore, today’s NFP is likely to see some major volatility at least as far as the USD Crosses are concerned.

