
The precious metals markets were trading mixed for the week. Gold futures were up a mere 0.21% for the week after prices tested the highs to 1127 late last week. A mixed US Dollar and rather slow markets have seen prices consolidate for the most part. It was reported earlier this week that China’s Gold reserves were at 1658 tonnes for the month ending June, noting a significant 600 tonnes increase in holding.
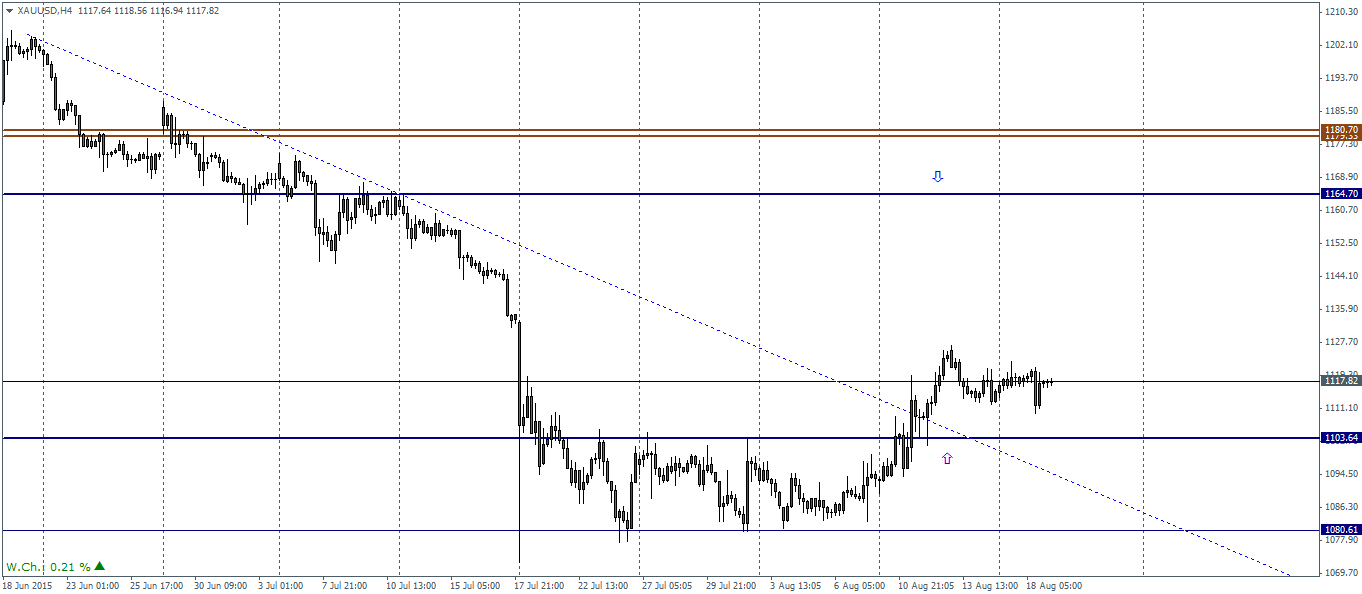
We anticipate further upside in store as far as Gold is concerned. Following up from last week’s analysis the 4-hour chart for Gold shows the break of the medium term falling trend line. However, prices are yet to test the broken resistance at 1103 to establish support at this level. We could therefore expect to see Gold prices decline in the near term to seek support at 1103 – 1100 ahead of a corrective rally to 1164 – 1150 region of resistance.
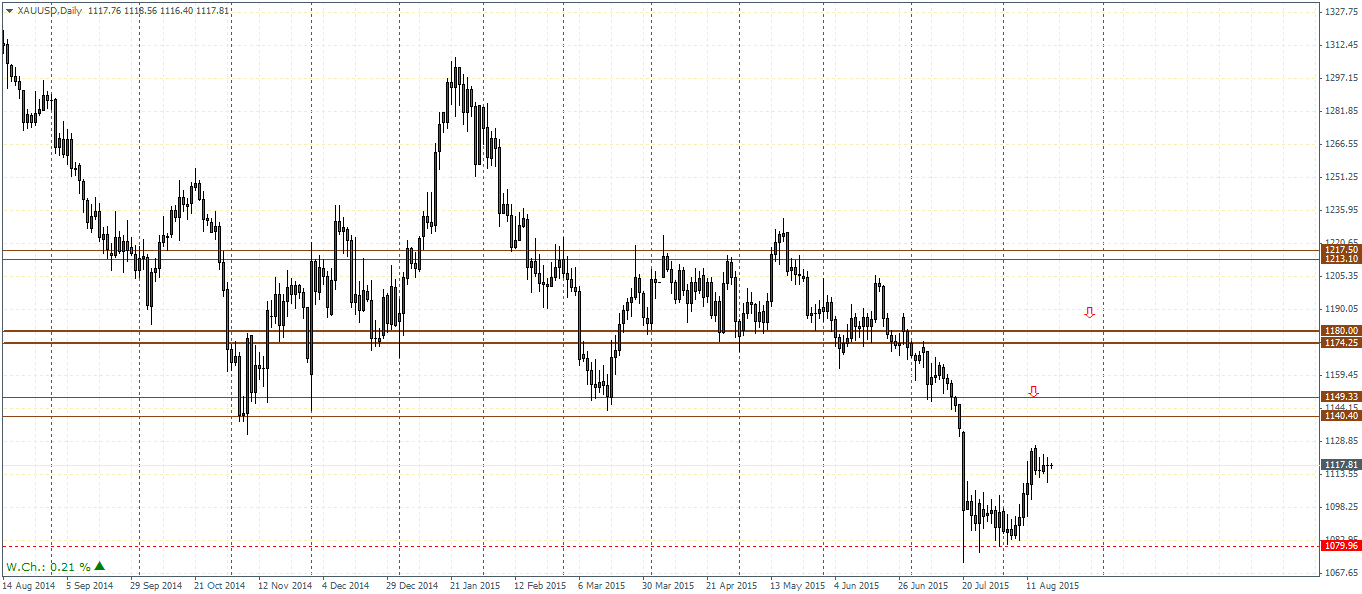
On the daily charts the bottom near 1079 – 1080 is very clear as prices formed a strong basing patter at this level with strong consolidation. The upside target shows the resistance on the daily charts at 1180 – 1140, which shows confluence to the resistance levels noted on the 4-hour chart time frame. There is a possible rally of a further test to 1180 – 1179 region as well which cannot be ruled out.

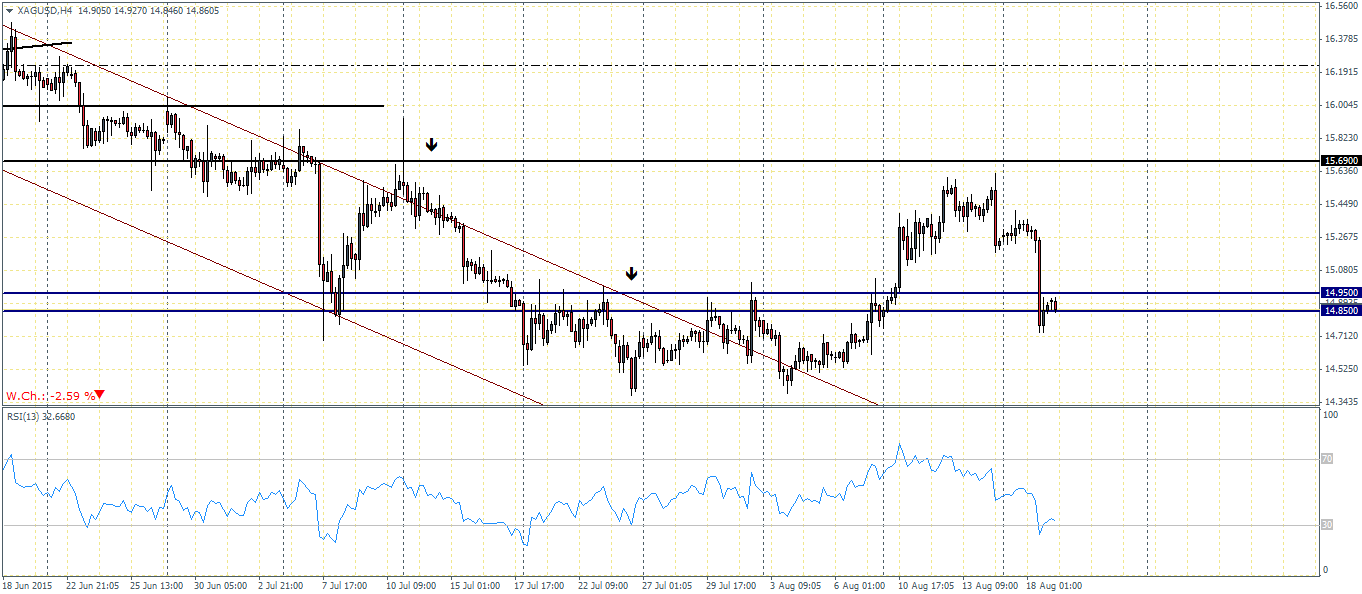
Silver prices have been weaker this week, trading -2.59% for the week after prices made a high near 15.63 late last week. Silvers prices promptly fell back to the identified support level at 14.95 – 14.85. If this support holds, Silver could potentially stage another rally in an attempt to test the 15.69 level of resistance which missed last week by a few points. To further the view to the upside, Silver is showing a strong hidden bullish divergence to the RSI at the current level of support. The RSI has posted a lower low while prices have posted a higher low in comparison to the previous lows at 14.46 in early August. Therefore a successful test of support could see Silver rally back to 15.69.
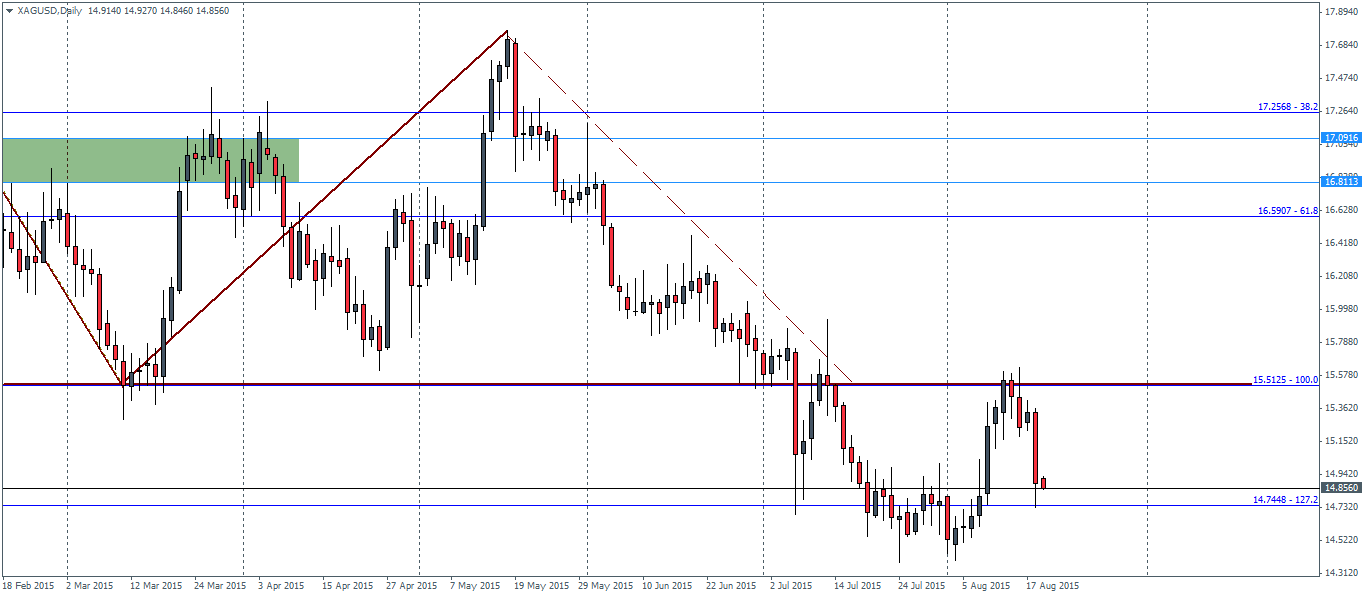
On the daily charts, the longer term head and shoulders pattern remains in play although the price action last week has shown a test to the head and shoulders neckline at 15.51. To the downside, a break below current lows at 14.75 will most likely see Silver break down to post new multi-year lows with the eventual target to 13.768
Looking forward, today’s economic calendar will most likely bring some volatility to the precious metals markets as the monthly consumer inflation data from the US is due followed up by the meeting minutes of July’s FOMC monetary policy. Expectations for the monthly CPI data is slightly on the dovish side with the economists polled expecting to see a 0.2% growth in inflation, down from 0.3% and 0.2% on the headline and core respectively. With the UK CPI managing to beat estimates yesterday it is quite possible that today’s US CPI release will very likely beat expectations and could thus put downward pressure on the metals markets.

