Dow Jones (DJI_5U)
16110
A rising channel …
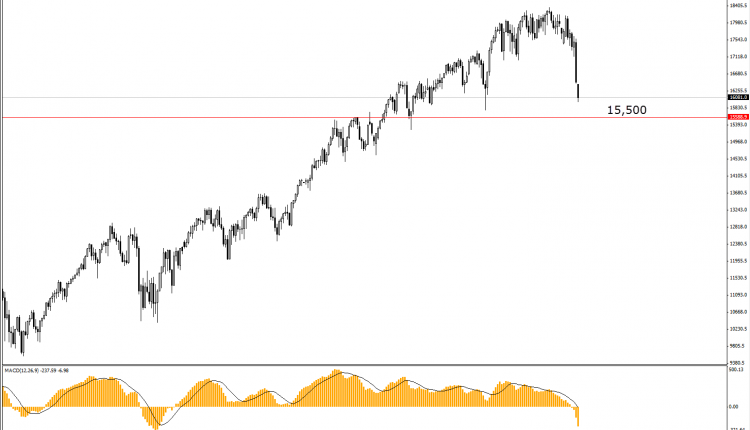
As shown on the chart the market is at the lower boundary of the rectangle patter ( the blue levels ) , and on the lower levels for the bigger rising channel at 17600/17500 levels ( Penetrated it already ! ), which would push the trader to long that position . However, if the coming NFP numbers or a negative development on the Greek Drama would support a negative breakout for the both patterns, in this case 17000s /16500s would be the target for that correction.
On the longer-term view ; the index would range with upward slope ( a slower positive rate of the price change ) toward the long term target of ( Since 2009) 20k for each index .However , if market felt below 17K / 16500levels would enter the mid-term correcting move for the major bull market targeting the levels of 15K/12K. This awaiting phase (the correction phase) is expected to start with First Rate hike or dovish tone at one of the FOMC statement.

** The following chart for the oil spot price ; the difference between chart price and future contract price ( DJ_5U) is 75.However , same analysis applied on both.
Daily Trend: Down
Weekly Trend: Up
| Support | Resistence | |
| Level 1 | 16000 | 16850 |
| Level 2 | 15850 | 17250 |
| Level 3 | 15500 | 17500 |

