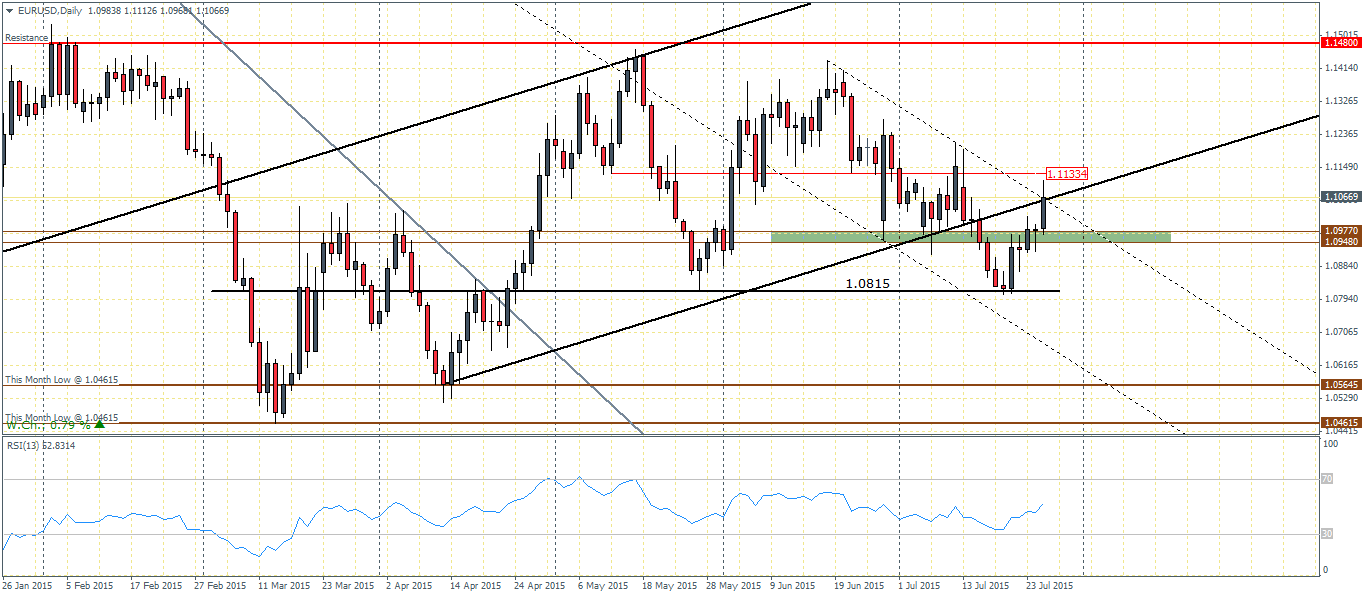
EURUSD (1.106): After declining from the highs of 1.14 in June, the single currency fell to the lows near 1.0815 this month. The decline was however well supported with a strong reversal from the lows of 1.0815 and has managed to clear the short term support/resistance levels near 1.097 – 1.0948. Plotting a minor falling price channel on the recent declines, we anticipate another test to 1.097 – 1.0948 level. If support is established here, EURUSD could potentially break out from the minor price channel and head back into the main rising price channel. This scenario would make EURUSD very bullish with the possibility of testing the previous resistance at 1.148. To the downside, if the support near 1.097 – 1.0948 fails to hold prices, a decline to 1.0815 could be seen with a further test down to previous lows at 1.04615, which was last tested in March this year.
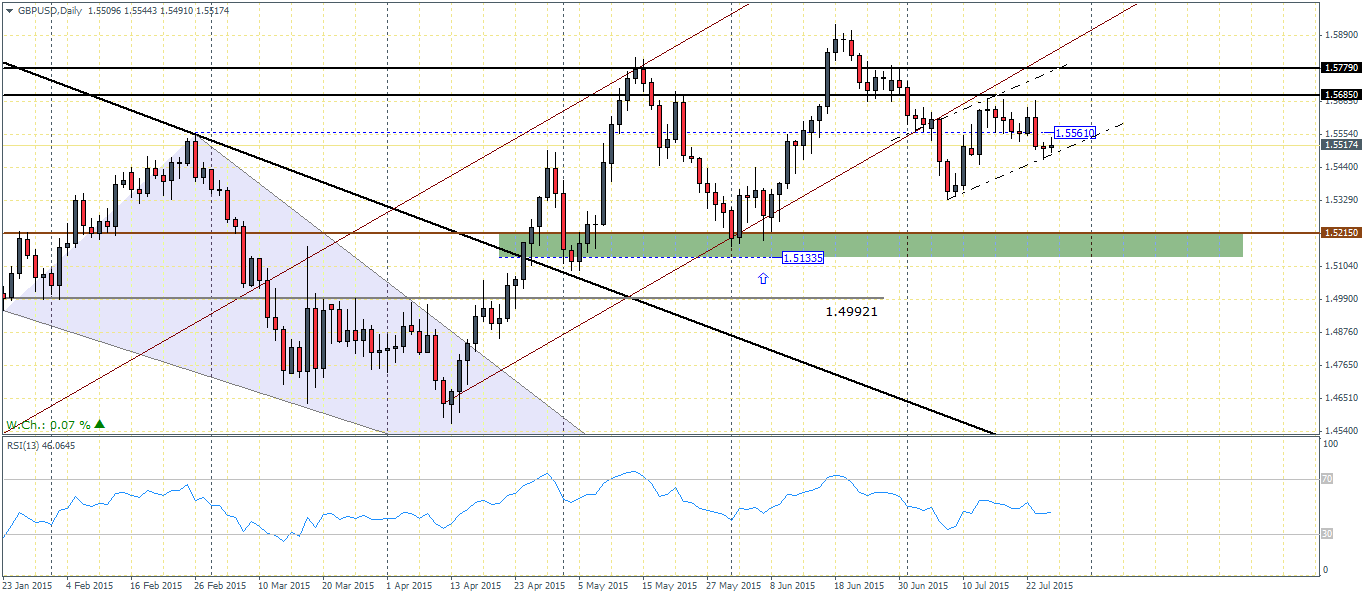
GBPUSD (1.551): Price action in the Cable has been trading sideways for the past couple of sessions from the daily chart time frame. However, the fact remains that GBPUSD broke out from the rising price channel and any upside moves will likely meet resistance near 1.5779 through 1.5685. A successful test of resistance here could send the GBPUSD to decline towards 1.5215 level of major support. To the upside, price needs to clearly break the resistance above 1.5779 in order to bring back the bullish view. There is also an additional risk of price forming a bear flag at the current levels, which gives a measured objective towards 1.5215 and 1.4992 levels.

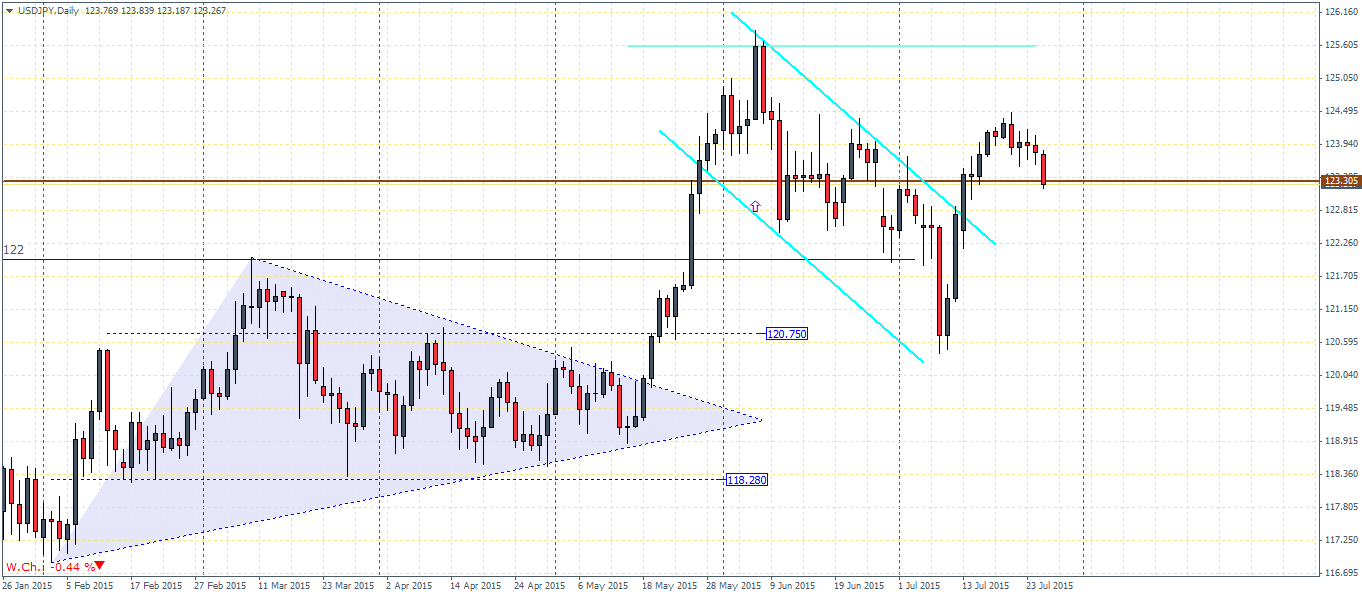
USDJPY (123.25): The break out from the major bull flag is starting to see some resistance as price saw a quick reversal near 124.5 region, identified by the bearish engulfing candlestick pattern. At the time of writing, USDJPY is seen retracing the break out level near 123.3. A successful test of support here should ideally see USDJPY rally towards 125.6. However, failure to hold prices at current levels (123.3) will see USDJPY turn bearish and look towards the next lower support at 122 and eventually 120.75. In such as scenario, the bear flag would stand invalidated and could shift USDJPY into a sideways trading pattern.
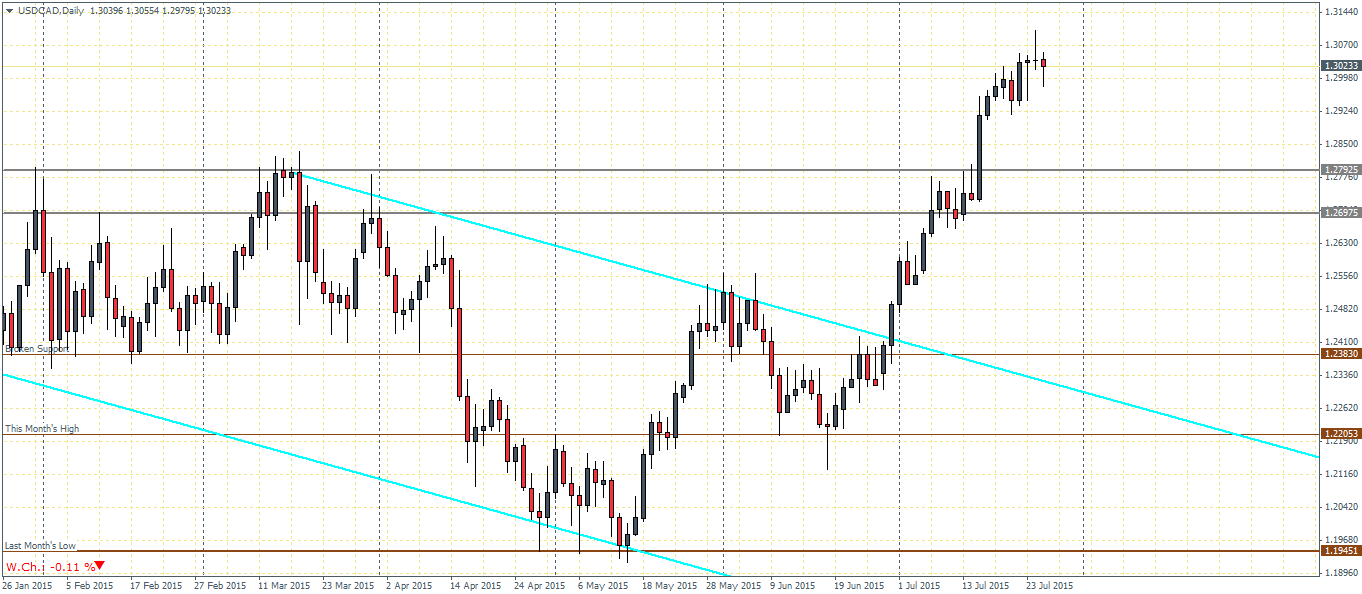
USDCAD (1.302): After a strong rally this month, USDCAD formed a sharp doji candlestick pattern near the top at 1.307. A bearish close in the next few sessions could see USDCAD decline lower to find support at 1.2792 through 1.2697 which was previously broken. Establishing support at these levels could see some renewed bulls enter the market and could potentially steer USDCAD higher. Failure to support prices near 1.2792 through 1.2697 will however see USDCAD decline back to previous support at 1.2383.
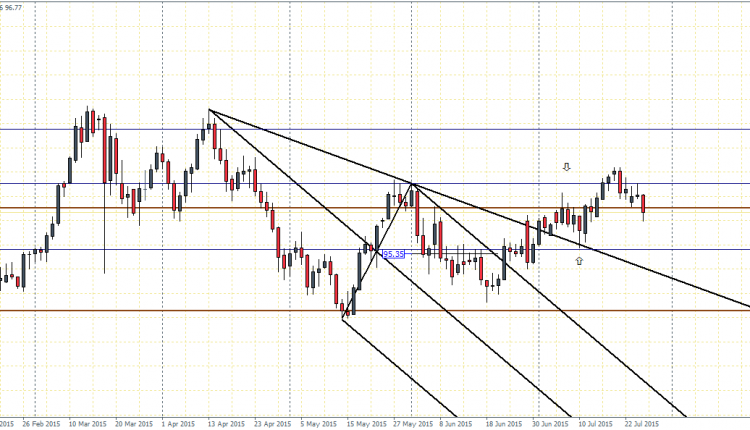
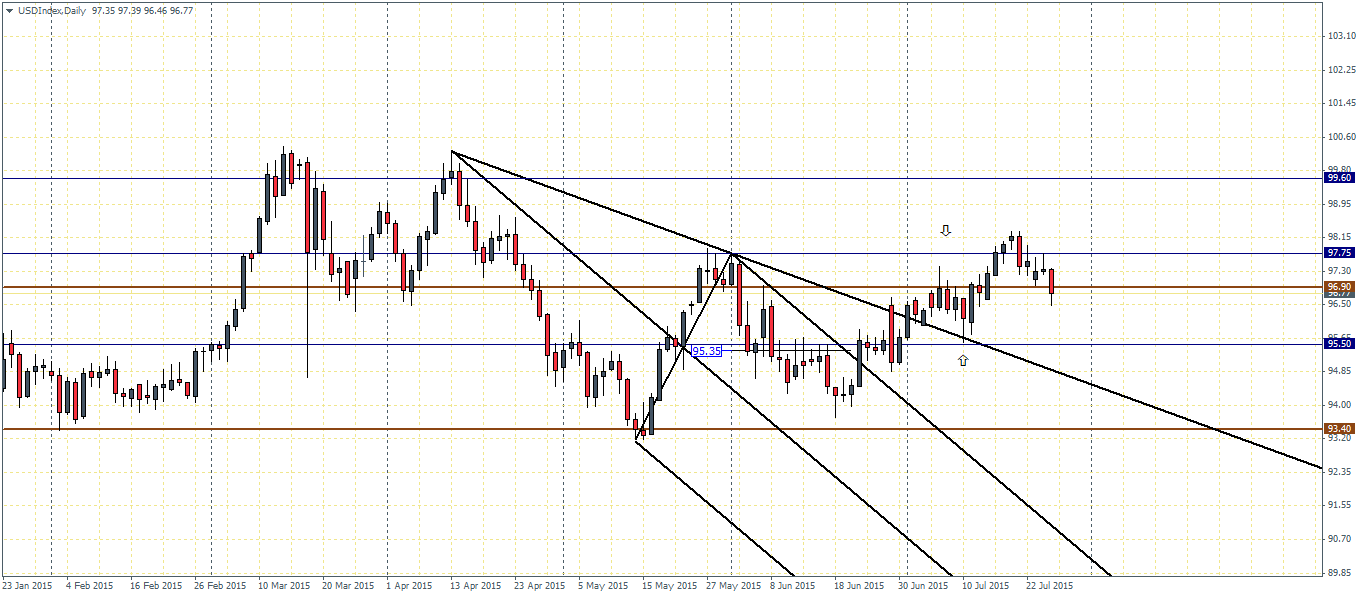
US Dollar Index (96.75): The US Dollar Index managed to post monthly highs near 98.15 but saw a quick reversal from these highs. Price action is currently trading near 96.9 level of support. Failure to cap the declines here could see USDCAD test the next lower support near 95.5 through 95.35.

![Credit Card 160×600 [EN]](https://assets.iorbex.com/blog/wp-content/uploads/2023/06/13144507/Blog-Banner_EN-Banner_160X600X2.webp)