
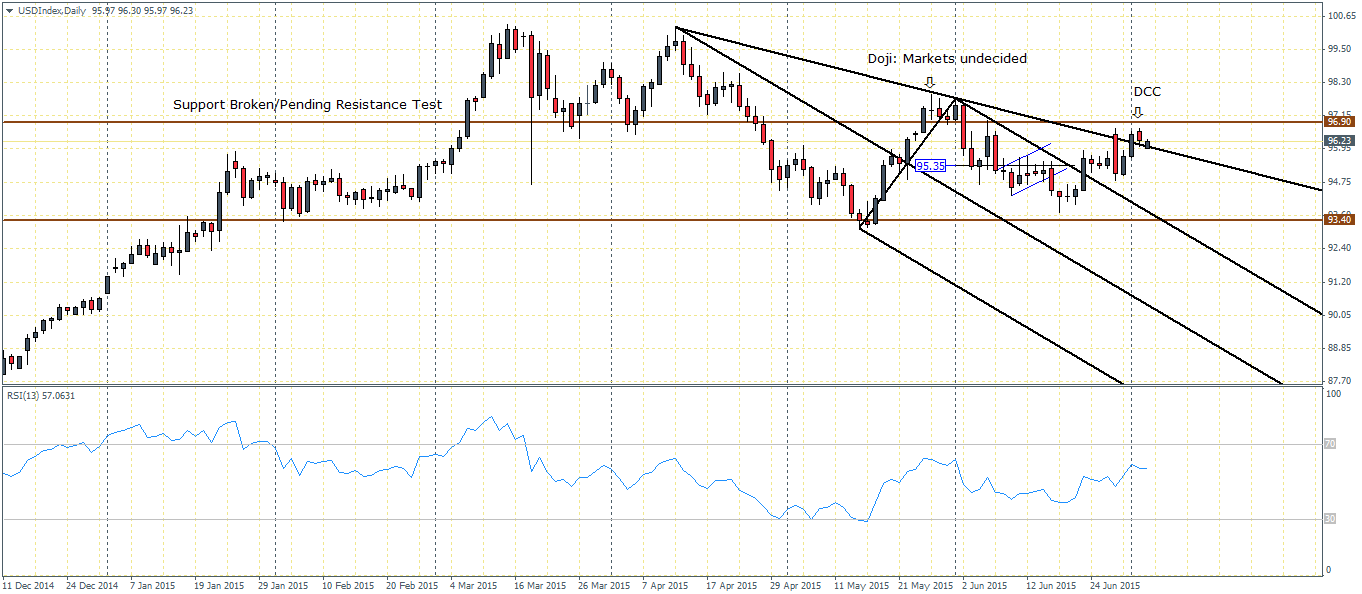
The US Dollar Index formed a very bearish looking dark cloud cover pattern yesterday after prices gapped higher from Wednesday’s close of 96.46 to open Thursday’s session at 96.58 and subsequently closed lower at 96.25. This bearish price action comes in the context of a modest recovery staged by the index after hitting monthly lows near 93.5 in June.
The bias, therefore points to the downside, if today’s price action fails to post a bullish close.
In the Daily chart for US Dollar Index below, we notice that the current price action is trading near the trend line connecting the two consecutive swing highs of the median line. Today’s price opened right near this line and therefore a close lower could no doubt bring new sellers into the market which could push prices lower. Support in the daily charts points to 93.40.

Switching to the H4 charts, we notice that the bull flag pattern formed a week ago saw prices break out and rally towards 96.55 level of resistance. Sellers overwhelmed the market here pushing prices promptly lower back to 95 support which again saw another leg to 96.55. Therefore, in the medium term, 96.55 resistance will be one to watch for as a break higher could invalidate the bearish bias from the daily charts and in fact turn the US Dollar more bullish.
Within this same view, we cannot ignore the large ascending triangle pattern taking shape as well with resistance at 96.55. A break of this resistance and a retest or a dip above 96.55 could completely turn the scales to the US Dollar build up bullish momentum with the prospects of posting new yearly highs above the psychological 100 level.
Any dips within the ascending triangle could see support near 95.85 – 95.6 region, which also shows confluence with the rising trend line (which forms the triangle).
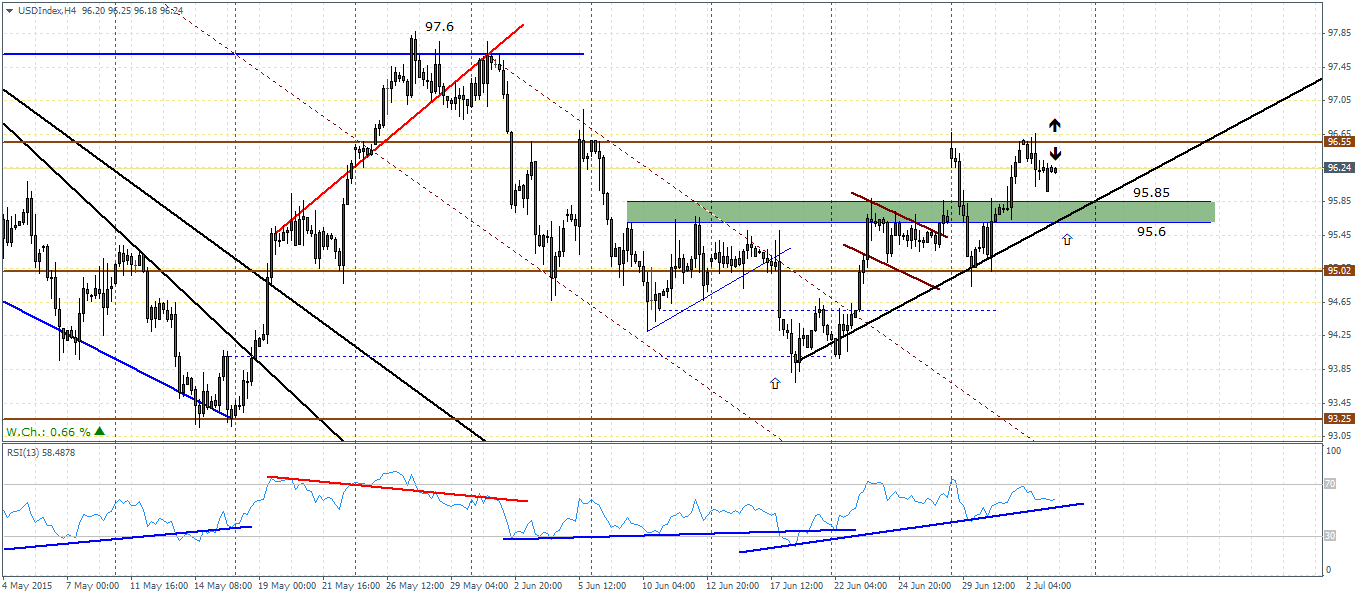
The RSI on the H4 time frame is also pointing to higher lows at the moment and thus keeping the upside bias intact for the moment.
Fundamentally, the US Dollar Index looks a bit supported to the upside with the most recent June nonfarm payrolls data coming out as a mixed bag. While unemployment rate beat estimates improving to 5.3%, from 5.5% a month ago, the average earnings has remained flat for the month. While it is unsure as to how the Fed would react to this data, it does bring about a sense of certainty that the onus now shifts to the July payroll reports. But even in this case, the markets need to see a consistent performance in both July and August for any hopes of a rate hike. Inflation also hasn’t changed much in recent months which gives the odds of a Fed rate hike in September at 50-50. In this aspect, the US Dollar Index is most likely to offer some early clues into the price action in the coming weeks.
In summary,
- Large ascending triangle with resistance at 96.55. A break above resistance (and preferably a retest or a small dip) could shift the US Dollar Index firmly into bullish territory.
- Ahead of the break out from 96.55, expect a minor decline to 95.85 – 95.6 level of support
- A break below 95.85 – 95.6 and a break of the trend line could see the US Dollar index decline to 95 support
- On the daily charts, yesterday’s price action formed a dark cloud cover pattern indicating a move to the downside
- Today’s price opened right near the trend line and could shift the sentiment in either direction
- A bearish close to the downside on the daily chart could signal a dip to 93.4 support

