Crude Oil weakens by over 5% for the week, but bias remains to the upside
Crude Oil futures continued their decline since the week before. The downside momentum picked up as prices for Crude oil fell sharply this week, down by close -5%. A lot of factors contributed to the decline in Crude Oil including Greece and the Eurozone, the stock market declines in China and the Iran nuclear negotiations.
Earlier this week, the Energy Information Administration released its weekly Crude oil inventories report. Contrary to expectations showing a decline in stockpiles, the EIA’s report this week showed that US stock piles rose by 384k barrels for the week ending 3rd of July. The surprise rise in inventory brought the total US stockpiles to 466 million barrels, marking a highest level in over 80 years.
The sharp declines in Crude Oil since last week, should not be surprising for most as we had noted that sideways trend in the WTI Crude oil which lasted for close to 8 weeks after topping out near the highs of 62.1.

Crude Oil Technical Analysis
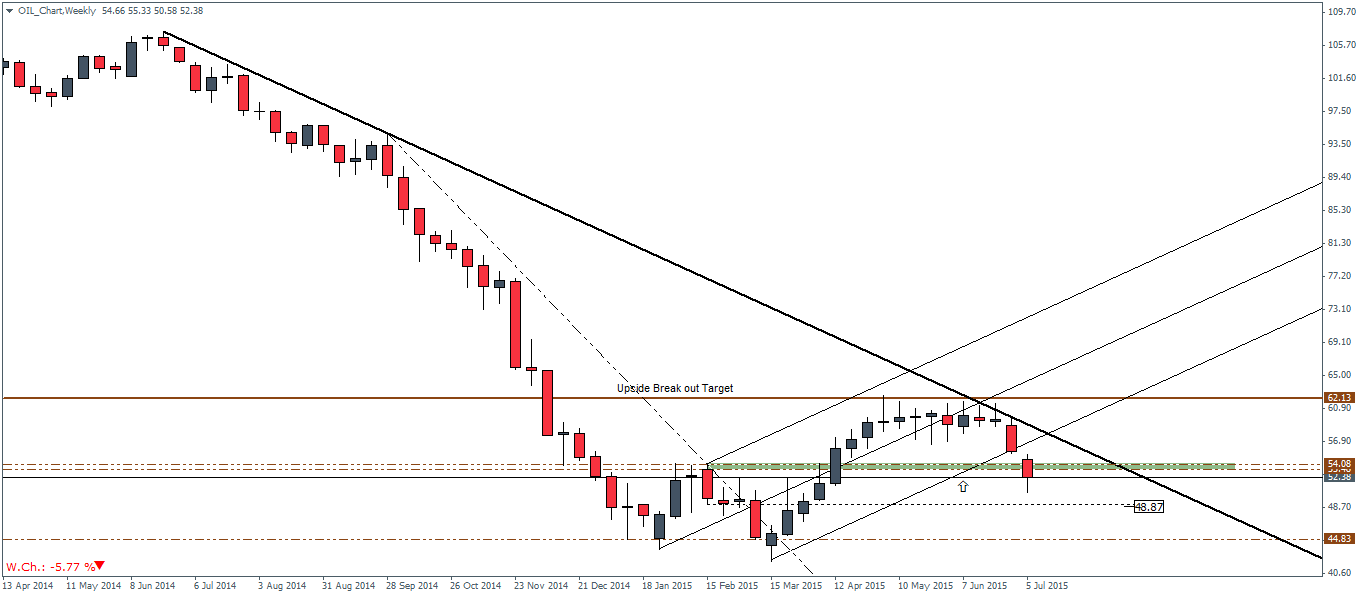
This week’s price action saw Crude oil prices dip towards 50.58. The weekly chart for Crude Oil shown below gives the major support level near 54 – 53.3 region. A close below this support could decline further to test lower support at 48.87. However, in the event that prices close in the support zone, Crude oil futures could continue their rally this time potentially breaking above 62.13
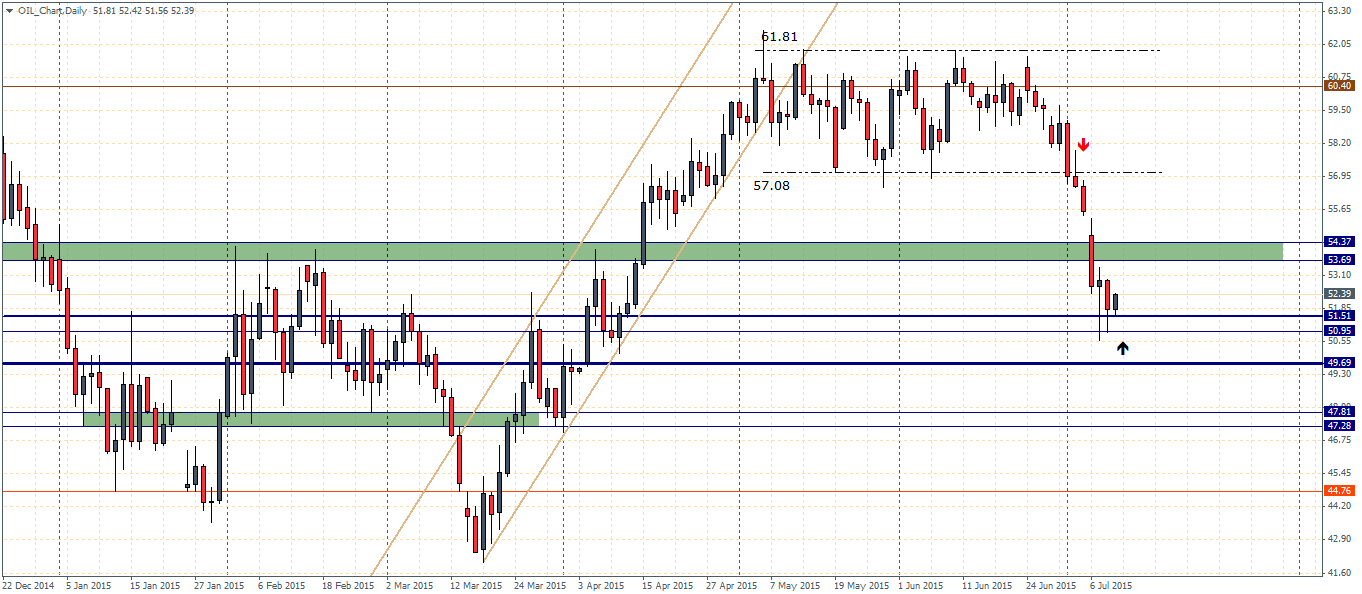
On the daily charts, we can see that after the sideways price action formed between 61.81 and 57.08, Crude oil broke down and cut across the first support at 54.37 – 53.7 level. Currently price is trading near a minor support region of 51.51 – 50.95. A break lower could see Crude Oil decline down to test 49.7 level of support.
Although Crude Oil might look bearish in the short term, the current declines are more likely a correction to the impending longer term rally. Crude Oil futures are most likely to close higher in the coming months with the potential to rally to as 71.75, a major support/resistance level that is awaiting a retest of prices.
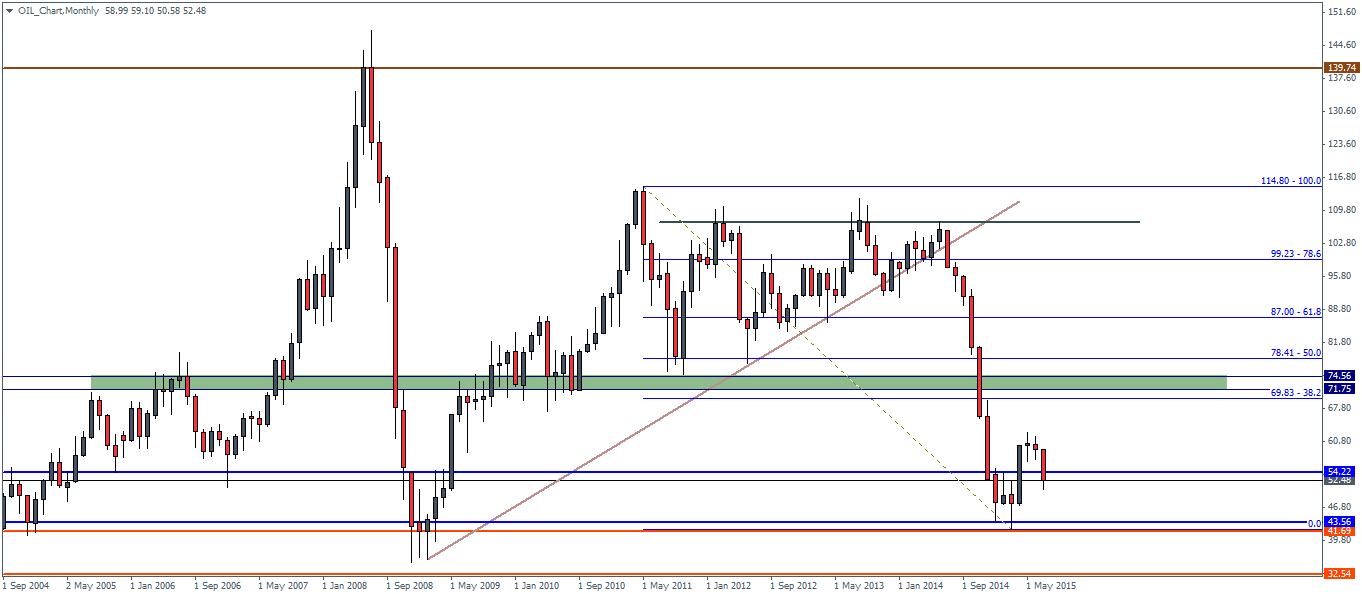
On the monthly chart shown below, Crude Oil has been mostly flat for the last two months resulting in a downside break out in prices. The monthly chart shows that a retest to the region of 49.5 is very likely, following which we could expect some kind of break out to the upside. A close below 47 will invalidate this view and shift the sentiment in Crude oil back into bearish territory.