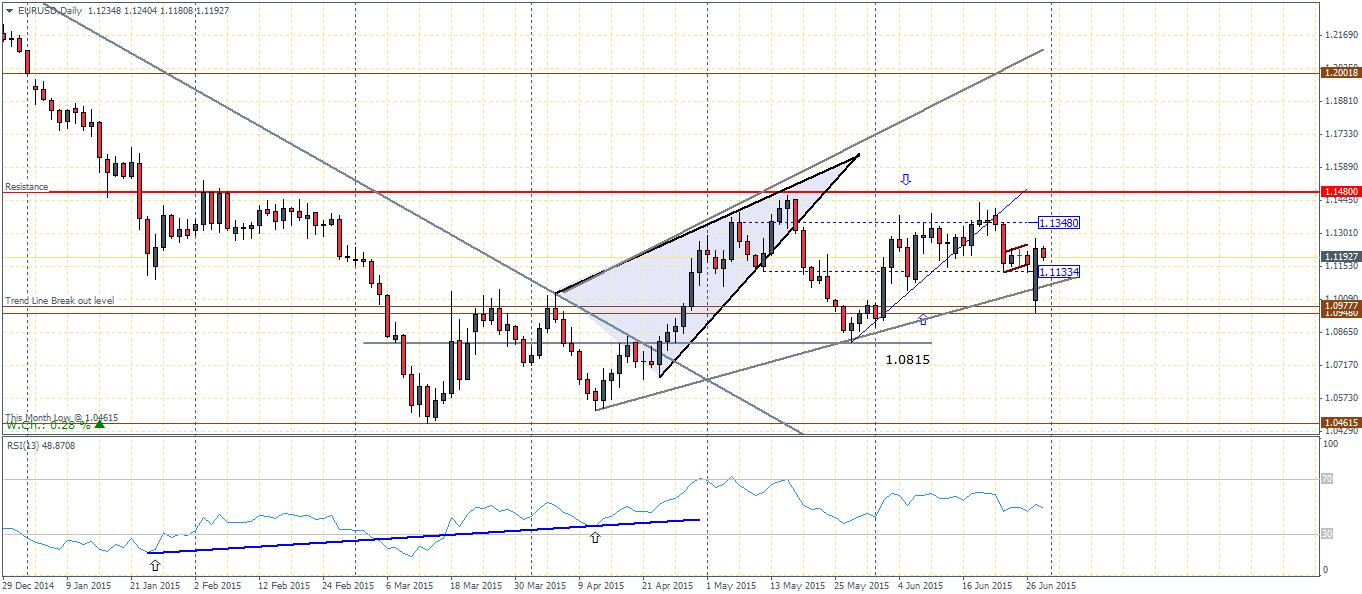
EURUSD (1.118): From last week’s mid-week technical update, EURUSD completed the bear flag pattern and dipped lower to support near 1.0977 – 1.0948 and closed on a bullish note yesterday. However, it is unlikely that we could expect a further rally to the upside as there is a potential for sideways trading for the next couple of sessions. There is an added noise of US economic data, but the Euro could simply wade through the noise while continuing its holding pattern into July 5th Greek referendum. We do however see a bias to the upside from a purely technical perspective. The test of support at 1.095 (rounded off) is indicative of a possible break higher. In this aspect, a test to 1.148 is very likely, but needs to be confirmed on a breakout from the range high and low from yesterday’s price action at 1.12775 – 1.0953.
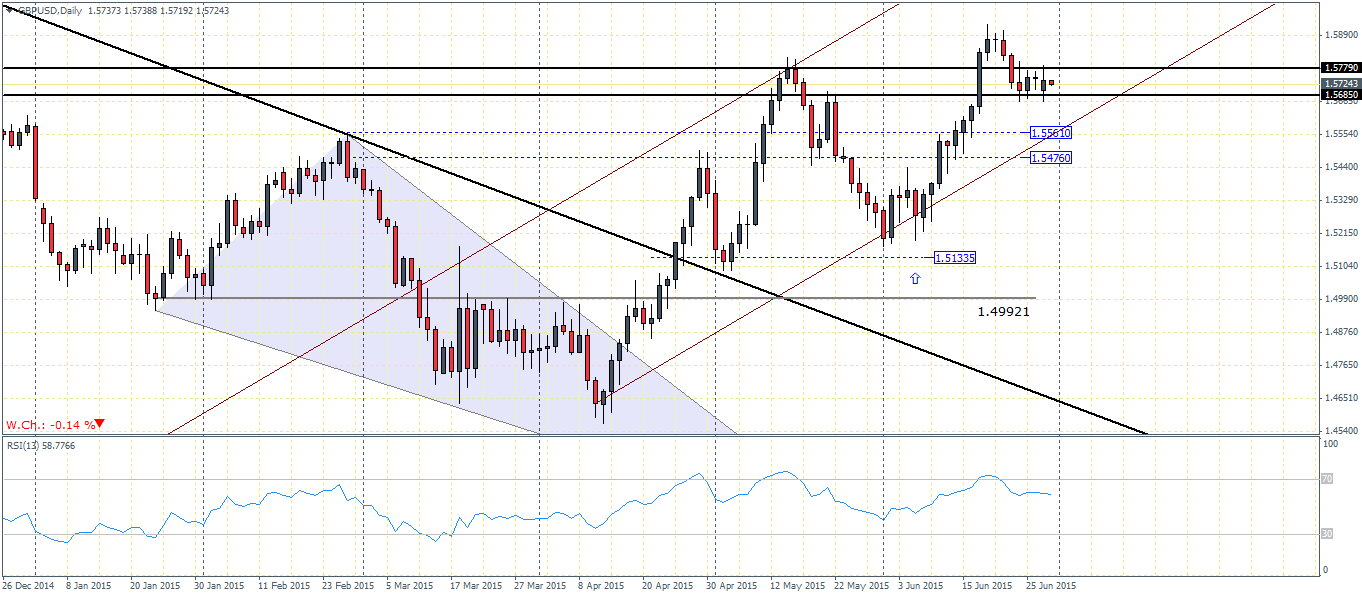
GBPUSD (1.5722): For the past 5 daily sessions, GBPUSD has been caught in the range at the support zone between 1.5779 – 1.5658. We could therefore expect a potential break out this week. To the upside, a break higher could see the potential to post new yearly highs above 1.59, while to the downside, minor support at 1.556 – 1.5476 could hold the declines. There is a risk of breaking the rising price channel which could put the price action into bearish territory with a decline down to 1.51335. Today’s UK GDP final revision for the Q1 2015 is due for release which could be a likely catalyst ahead of Thursday’s US NFP.

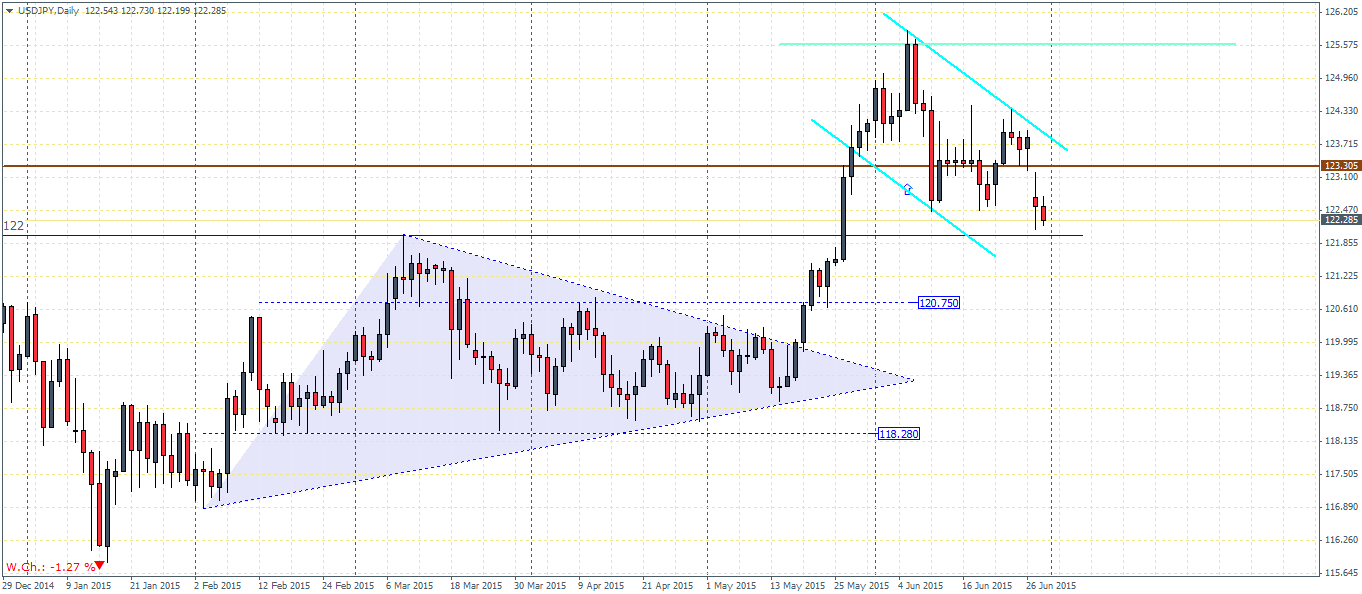
USDJPY (122.3): Price action in USDJPY indicates a bullish flag pattern, which is rather large in terms of price range and time. However, a successful break of this bull flag pattern could set the stage for USDJPY to test the price region around 130. Of immediate interest is the support at 122. If the support holds, a test to 123.305 is likely, which needs to be broken and tested for support to break out higher to the next price level of 125.575 en route to 130. A close below 122 could spell fresh losses in USDJPY to 120.75 support.
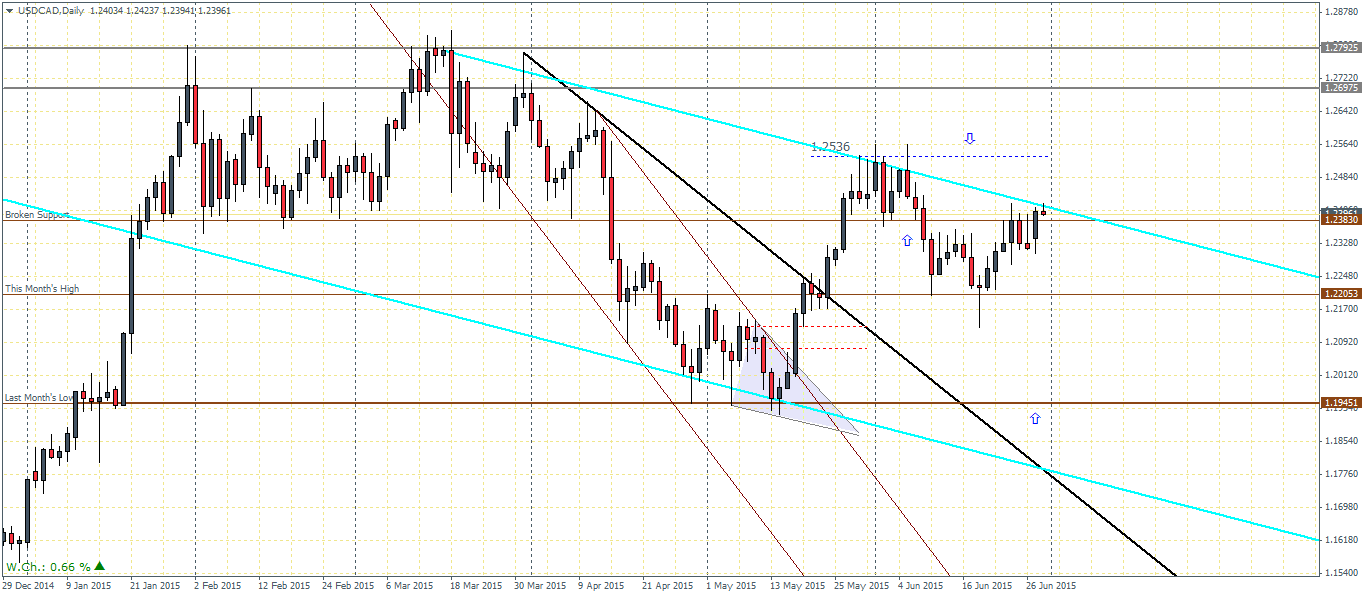
USDCAD (1.239): USDCAD has been range bound between 1.2383 and 1.22053. Price action is currently trading near 1.2383 having broken this resistance on a bullish note. A firm close above 1.2383 could see a test to 1.2536 and eventually target 1.26975. Alternatively, to the downside, a break of support at 1.22053 could send USDCAD lower to 1.11945 eventually. The new falling price channel plotted on USDCAD does indicate a potential shift to the downside, but one that needs to be seen on a close below 1.2383.
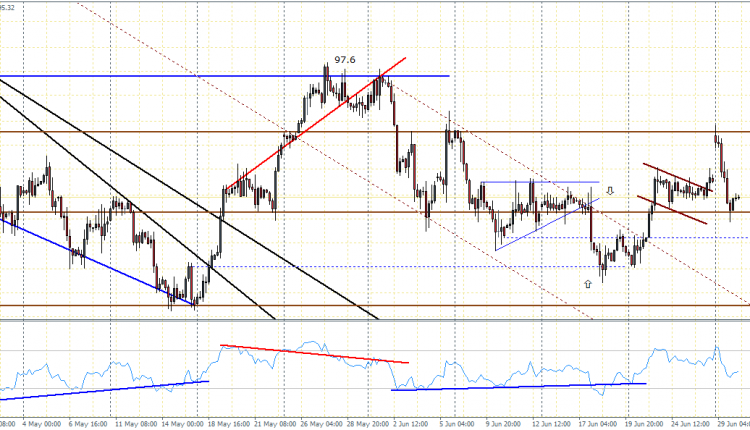
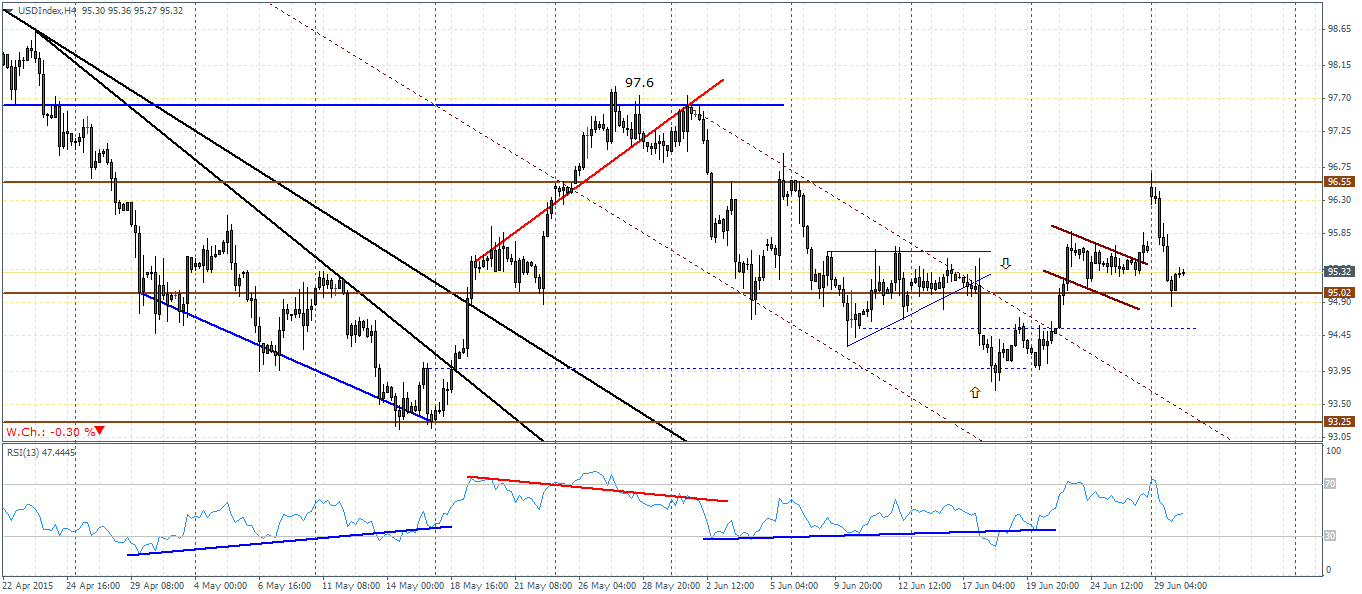
US Dollar Index (95.33): The US Dollar index broke out from the bull flag pattern and promptly rallied to test resistance at 96.55, marking a second test of resistance at this level. Price then fell back down to support at 96. A close below 96 could see a new leg in the decline towards 93.25 eventually. On the other hand, should the current support at 95 hold up, US Dollar Index could attempt another test of 96.55 resistance which could give way this time leaving the gates open to test previous highs near 97.6

![Credit Card 160×600 [EN]](https://assets.iorbex.com/blog/wp-content/uploads/2023/06/13144507/Blog-Banner_EN-Banner_160X600X2.webp)