EURUSD(1.097): The breakout from the rising wedge/triangle pattern saw a sharp decline to 1.0815 support level. Price action formed a reversal pattern at this support to rally towards the longer term support/resistance level between 1.097 and 1.095 levels. Yesterday’s price saw a bearish close at this level bringing a bit of uncertainty to the recovery. In this aspect, today’s price action in EURUSD will be important for watch for. Specifically, we are looking for a close above 1.097 level in order to see a move higher which could eventually see the rally target 1.1348, which marks a previous resistance and the breakout level from the rising wedge as well.
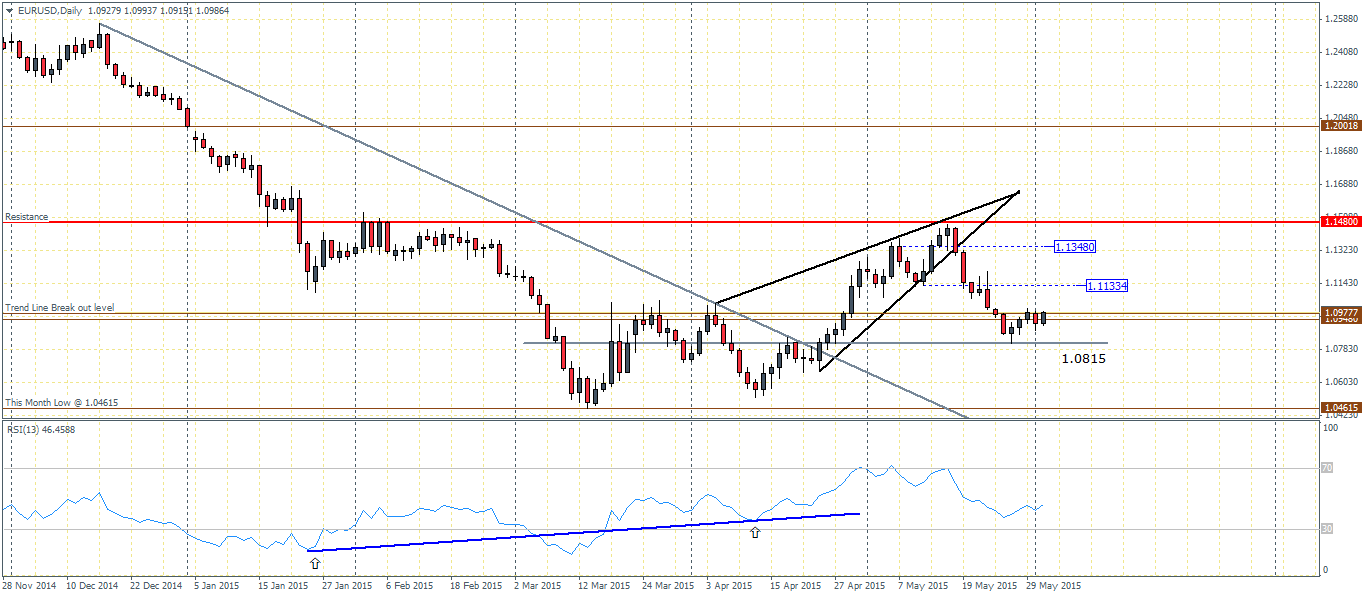
So far, the RSI looks to be confirming the upside move but it is essential for price to hold above 1.097.
GBPUSD(1.523): The Cable saw a surprisingly weak decline after a strong rally to 1.575, which was a continuation of the upside breakout to the falling wedge/triangle pattern. In the process, the GBPUSD formed a strong rising price channel and the breakout near 1.5476 saw prices falling below 1.52615. At the time of writing, the Cable is attempting to turn bullish but considering yesterdays price action, it is very likely that we could expect an inside bar. This would raise the stakes for a possible downside move targeting the previous resistance at 1.51335. In the event GBPUSD breaks above yesterday’s high of 1.53, a quick rally to retest the breakout at 1.5476 could prove to be an attractive level for sellers.

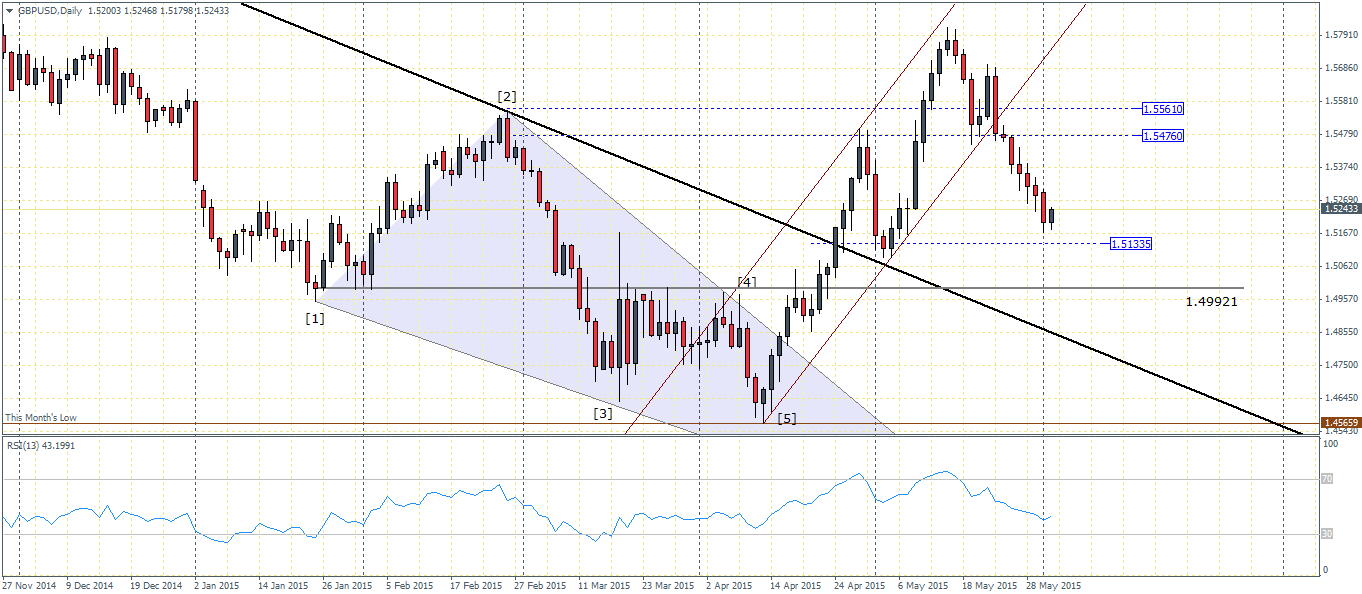
The current declines will most likely see an eventual dip to 1.49921 resistance level that could be tested for support before we can expect to see any rallies in the Cable.
USDJPY(124.7): The USDJPY eventually broke out above the highs at 122 to post fresh multiyear gains. Price is currently holding above the 124 handle but we suspect a dip to 123.305 being the most appropriate view to establish a short term support level. To the upside, the measured move of the triangle break out gives a target to 127.76 which is where USDJPY could be headed on a successful test at 123.305
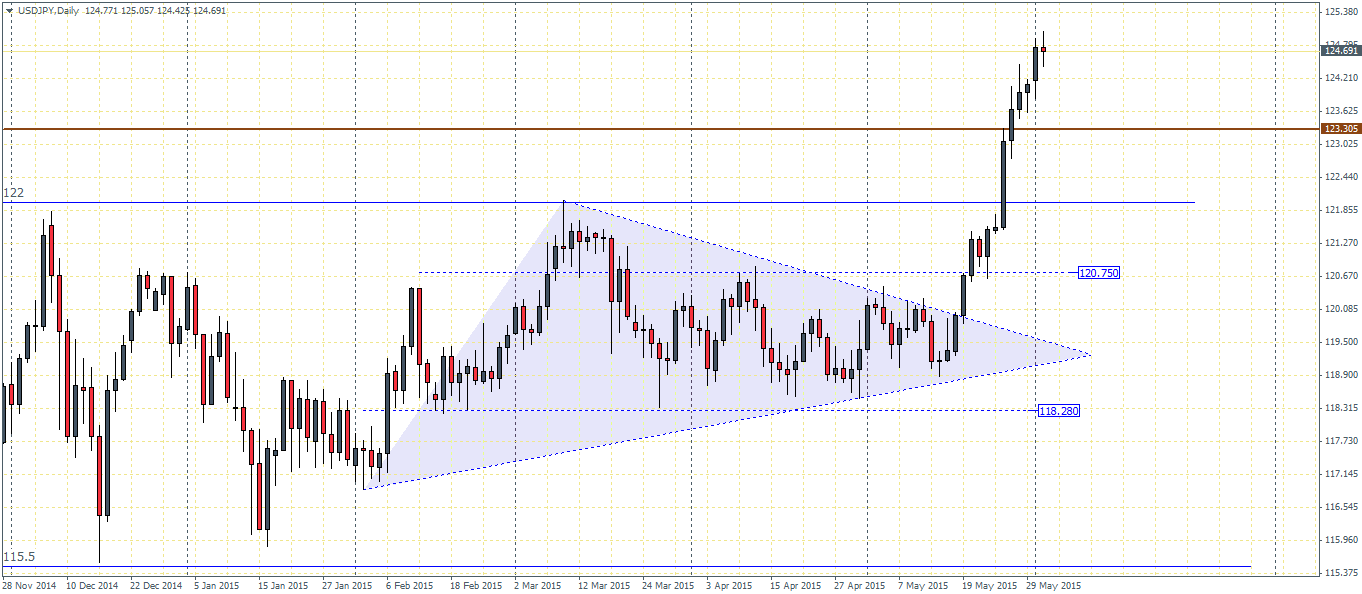
Combining the USDJPY moves with the EURUSD and GBPUSD, we get the general feeling that the Greenback could see a short term weakness set in before it can rally. For the USDJPY however, the 123.305 level will be important to watch. A failure to hold prices here could see a failed triangle pattern that could turn very bearish in an instant. To the downside, if prices break below 123.305, the next levels that come into play are 122 and 120.75
USDCAD(1.252): The Loonie managed to weaken in the previous few weeks leading to USDCAD posting strong gains after hitting fresh monthly lows to 1.1945. The minor falling wedge/triangle pattern saw an upside breakout near 1.21325 and an eventual break of the falling trend line. The broken resistance levels near 1.2383 is pending to be tested for support and on a successful test of support could see the USDCAD target 1.26975 through 1.27925 as the next level of resistance.
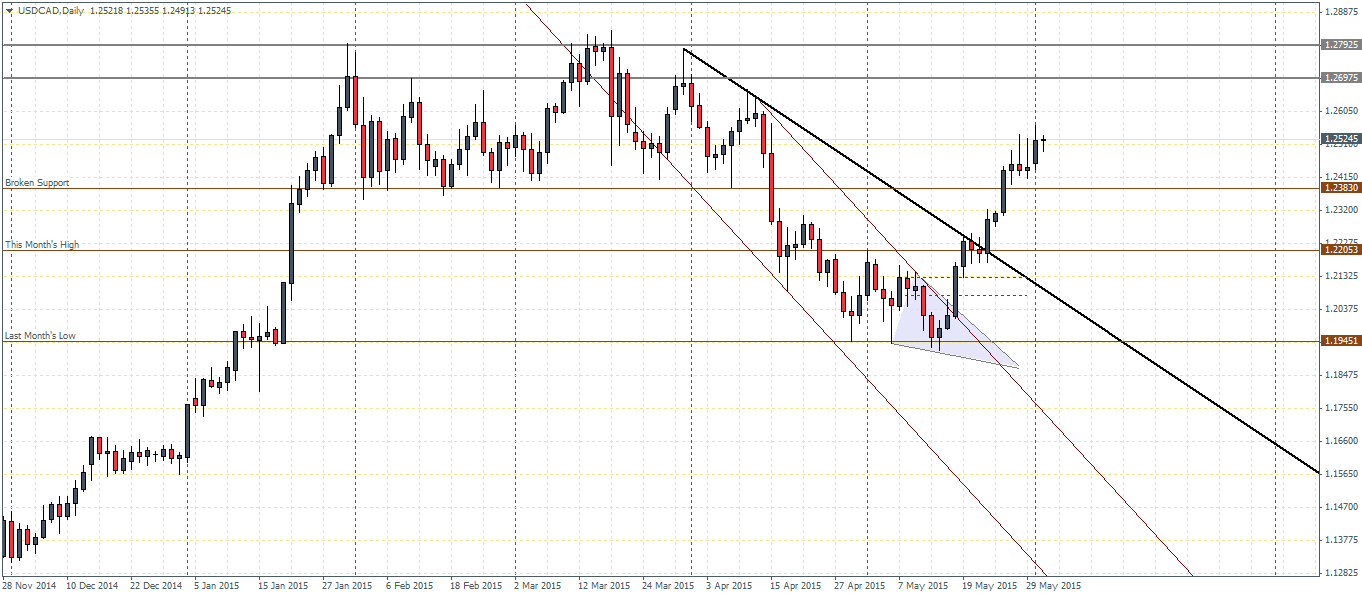
Alternatively, should price fail to hold near 1.2383, the decline could prompt the test of the next support at 1.2205
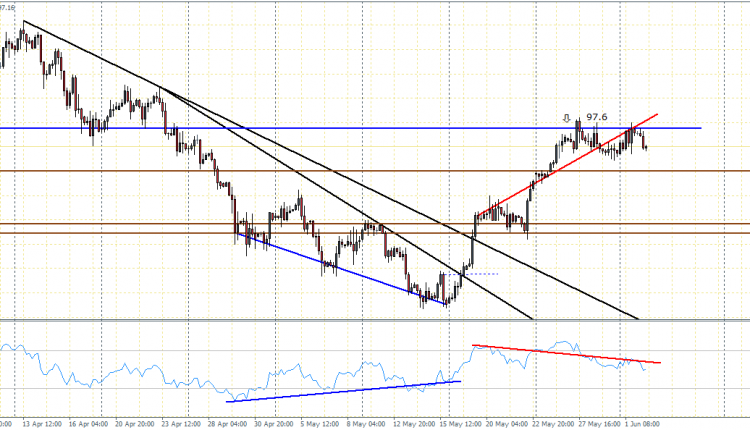
US Dollar Index(): The US Dollar Index saw a strong rally after price managed to establish support near the 95.25 – 95 price level. The rally managed to see a sharp break of the previous resistance at 96.55 as well but stalled near 97.6 which was a support turned resistance level. So far we notice that the US Dollar Index has failed on two attempts to break above 97.6 which could possibly see a test to 96.55 level. From here on, price action could prove to be critical as a test of support could attract buyers that could help eventually break 97.6 resistance. On the other hand, if sellers overwhelm the markets, then a break below 96.55 will see a test to 95 support.
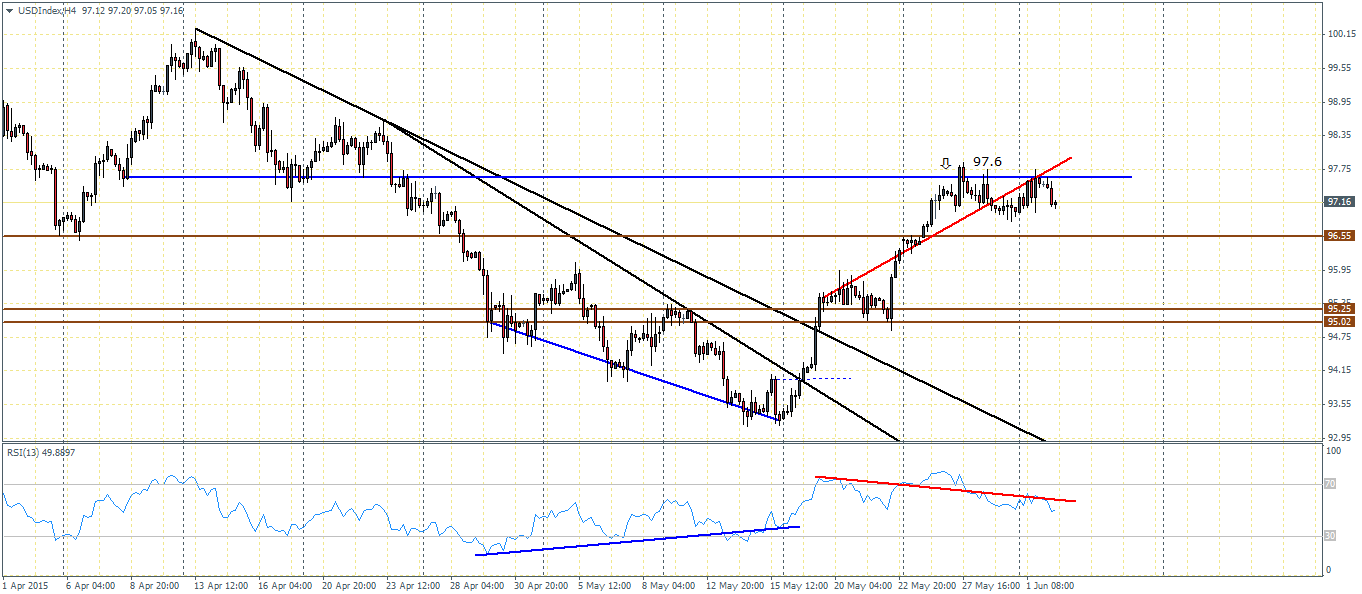
There is also a bearish divergence building up which in fact points to a correction to 95.25, but for this to happen, 96.25 will need to give way as support.

