
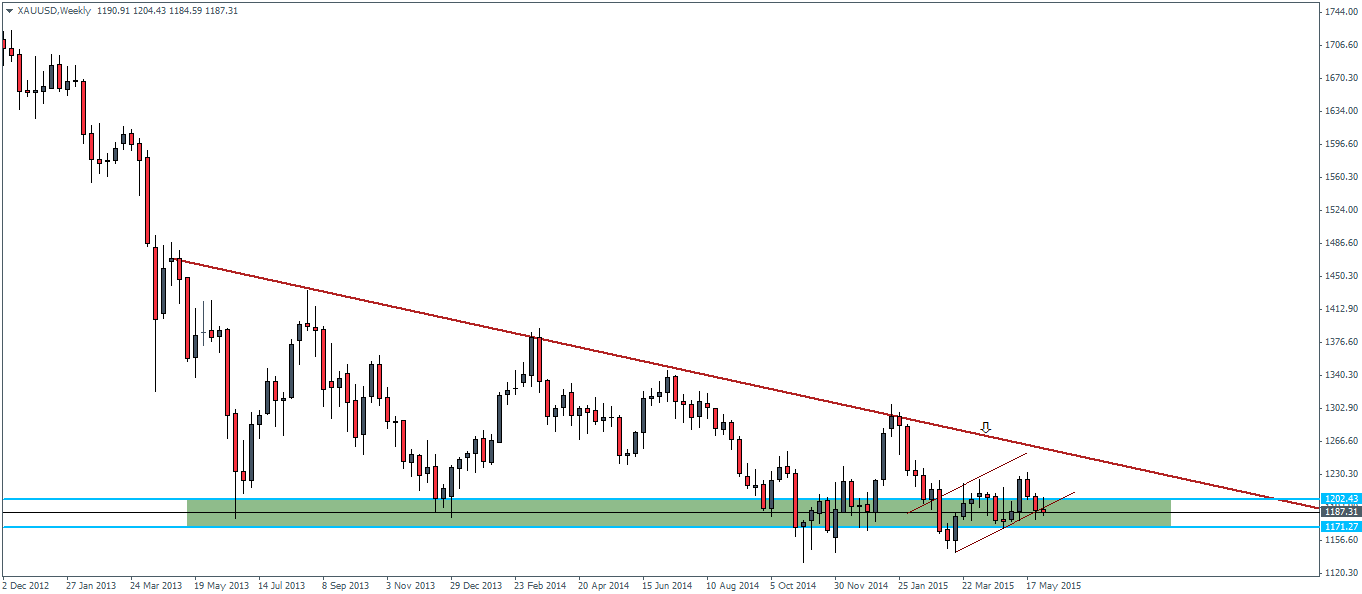
Gold futures, although a bit choppy on the shorter time frames is starting to look a bit bearish on the Weekly time frame charts with this week’s candlestick currency threatening to break out from the lower rails of the bearish flag near the support level of 1202 – 1171.
Within the weekly charts, we would like to see a clear break below 1171 in order to make this view more valid. So far, Gold prices have turned bearish for the past two weeks after price action formed a bearish looking dark cloud cover pattern. In this aspect, we are on track to validate the bearish call, but a validation of this view below 1170 – 1171 will cement the opinion.
On the intra-day charts, the H4 time frame, we notice that after a break out from the falling price channel, price saw a sharp rally to previous broken support at 1203 – 1200. This broken support has now turned to resistance although it was tested with only two candlesticks. Price action more recently saw a small bounce off the 1187 level but failed to push higher and is back to trading near the 1187 zone. A close below 1180 is essential to ascertain the bearish view drawn from the weekly charts.

On the H4 time frame, support is seen between 1180 and 1174 level and a clearing of this support would see a confluence of the H4 time frame as well as the weekly time frame levels.
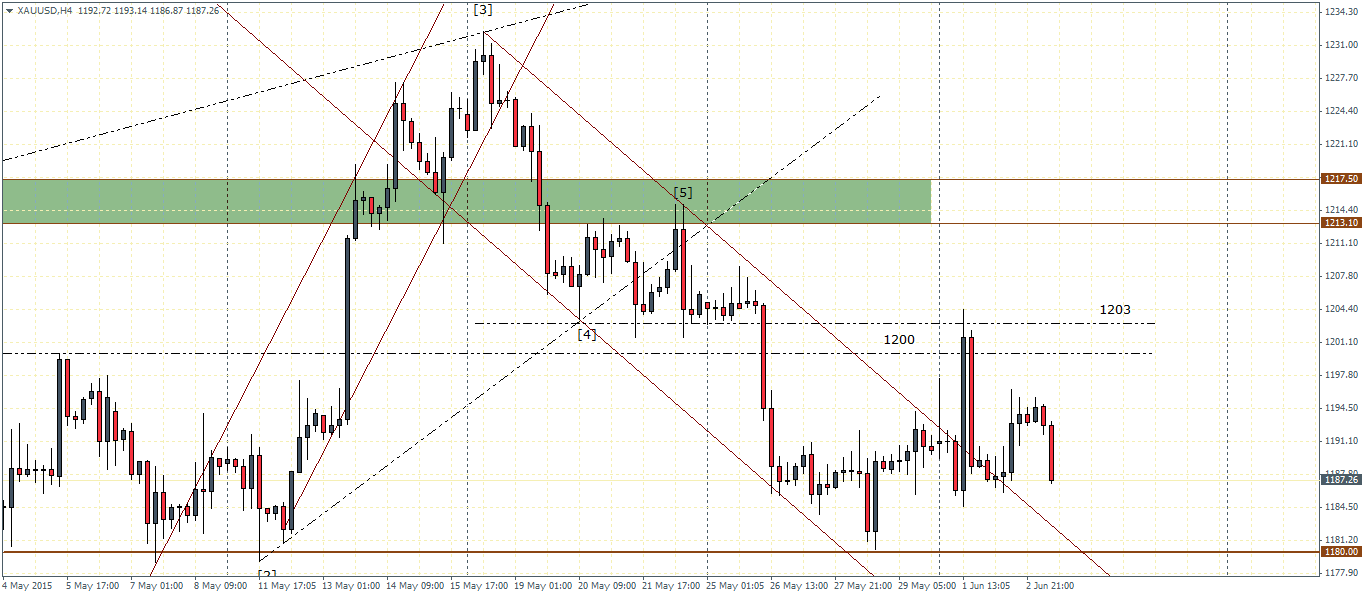
An alternative view could be that if the support near 1180 – 1174 holds, we could expect to see another leg to the upside which could result in continued sideways price action for a while before the markets give further clues. To the downside, however a break below 1174 will see a drop towards the next support level at 1145 – 1125.
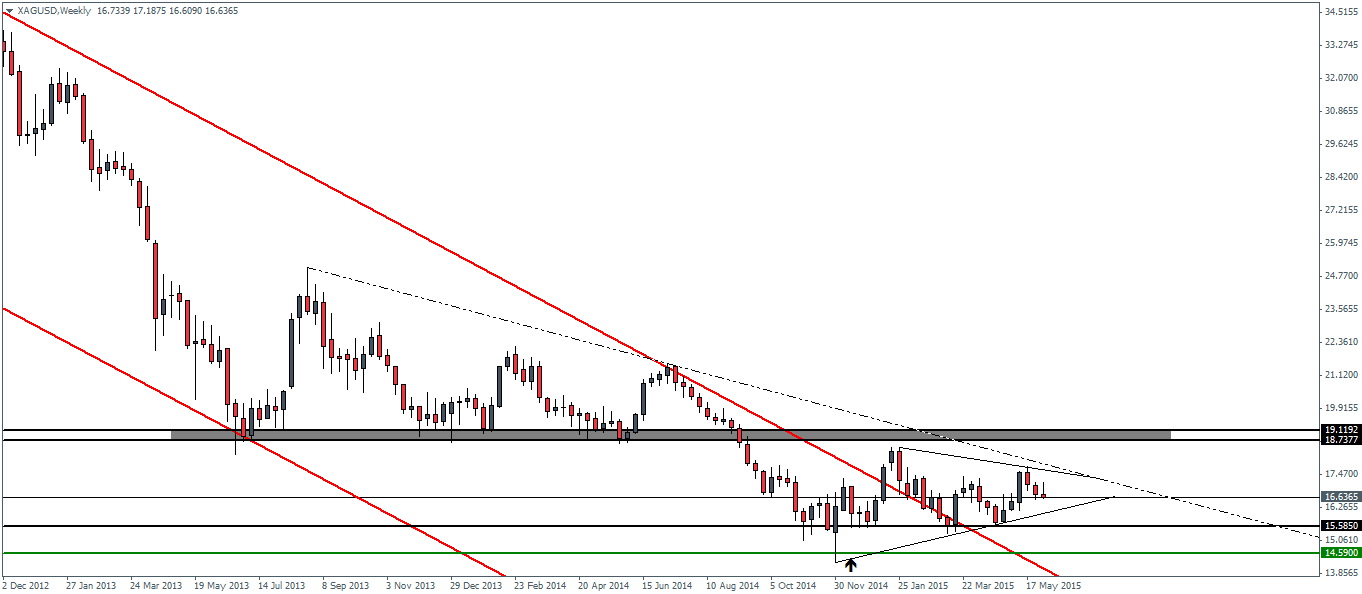
Silver futures have also been trending lower after spotting a similar price action candlestick pattern three weeks ago. Price is however shaping into a triangle pattern near the weekly support zone between 15.58 and 14.6 levels which points to a possible upside move unless the support near 14.59 breaks.
Switching to the H4 chart time frame, we notice a similar price action again, where price after breaking out from the falling price channel saw a brief rally to 17 – 16.93 broken support to establish resistance. Price then quickly broke the longer term rising trend line and is back to the horizontal support near 16.639.
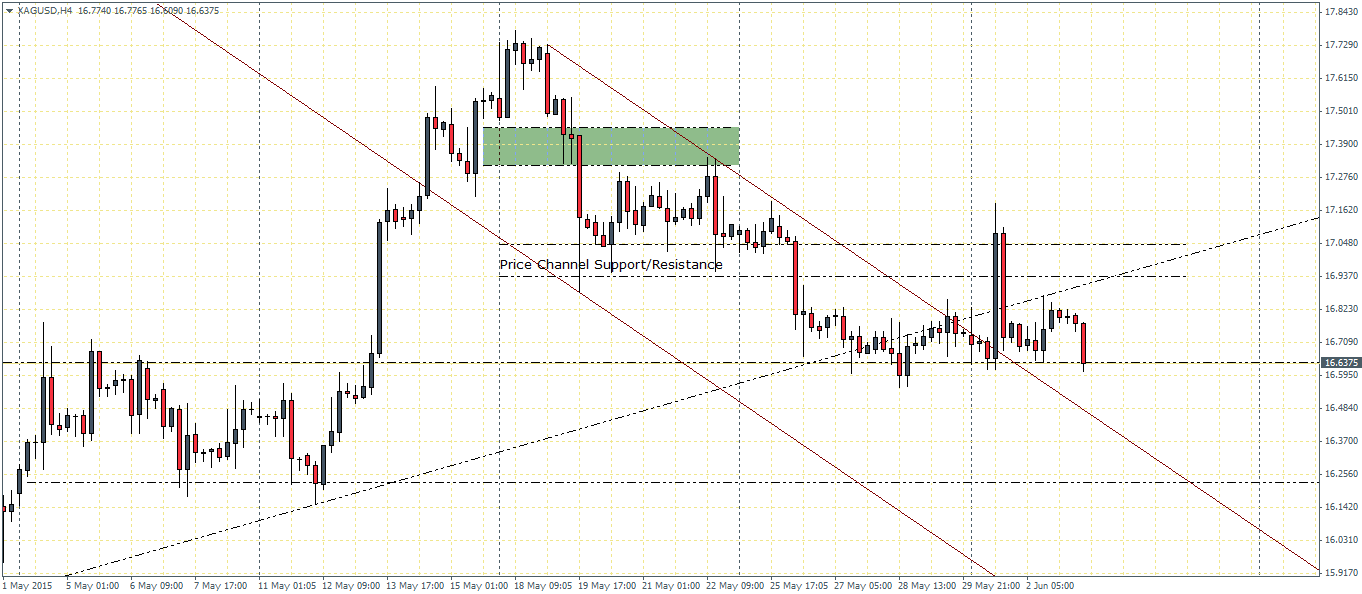
If prices close below 16.639 with bearish momentum, we could expect a decline towards 16.25 levels in the medium term. However, expect a few bounces on the decline as price tries to find dynamic support near the upper trend line of the falling price channel.
The fundamental risk to the precious metals comes from this week’s nonfarm payrolls data which could possibly decide the short term direction in the US Dollar Index which in turn could affect the precious metals.

