Gold futures have been trading in a tight range ever since prices hit a monthly low near 1171. The range high and low of the sideways price action has been capped between the lows of 1171 and the highs at 1192.
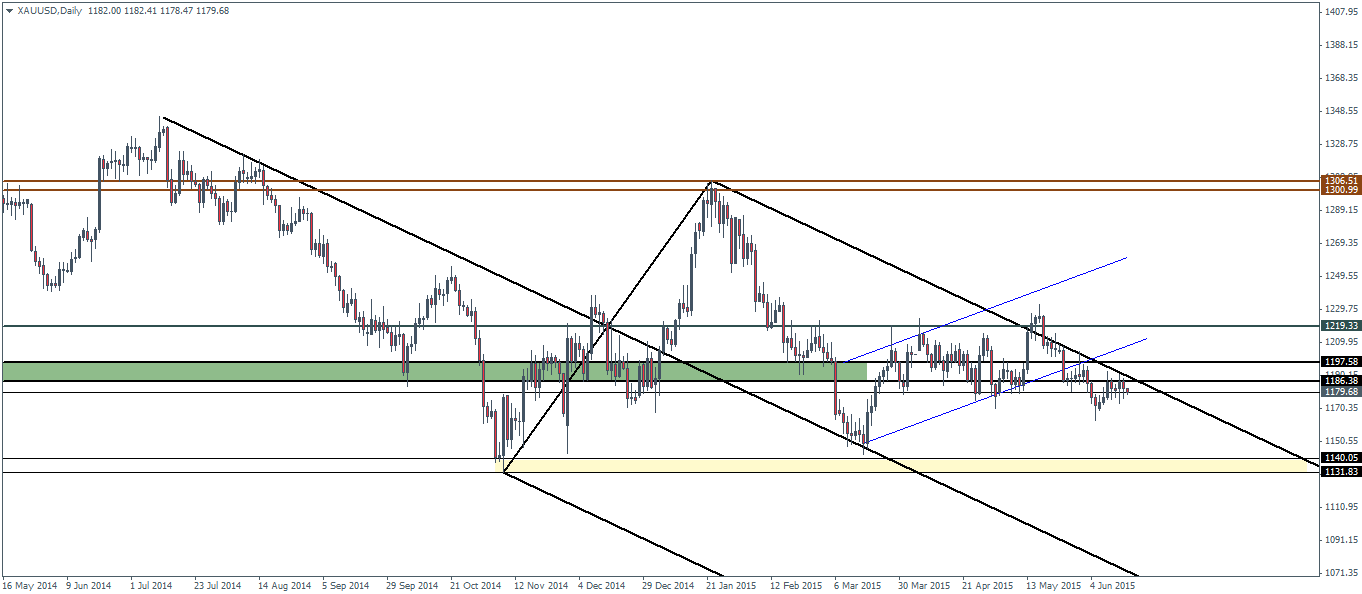
On the daily charts for Gold futures, price looks to have formed a double top near the resistance of 1186, which potentially points to a decline. Even on the bigger perspective, this sideways consolidation comes after a decline from the highs near 1221, indicating a continuation of the price action to the downside. But price of Gold needs to decline below the previous lows of 1171 to ascertain further decline towards the next support at 1141.
The daily chart below shows the consolidation taking place close to the upper median line which also shows confluence with the horizontal support between 1197 through 1186. Failure to break above 1197 will see a decline to the next support near 1140 and 1131. There is also the bearish flag pattern where prices broke out more recently. With no further support levels in between, Gold prices could very well see a leg lower. What remains to be seen is for how long the support at 1140 will hold before prices collapse below this support and post new yearly lows.

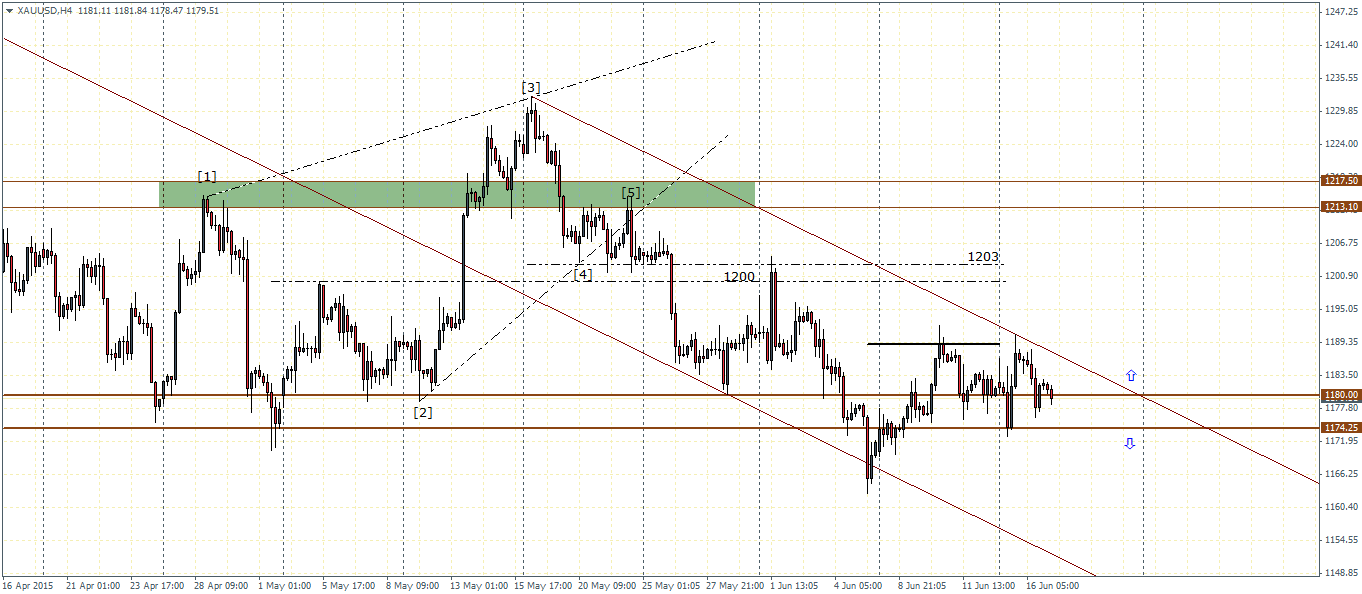
Moving to the intraday, H4 charts the falling price channel has been readjusted to reflect the more recent price moves. Here, it is evident that prices are now trading near the H4 support levels of 1180 – 1174. A break of this support could establish the view from the daily time frame of a potential decline lower. However, it would be best to wait for a retest of the broken support for resistance before anticipating further declines.
There is also a risk that prices could break out to the upside from the current support levels. In this aspect, watch for any break of the price channel, which will then set the stage for a rally towards 1189 and eventually back to 1203.
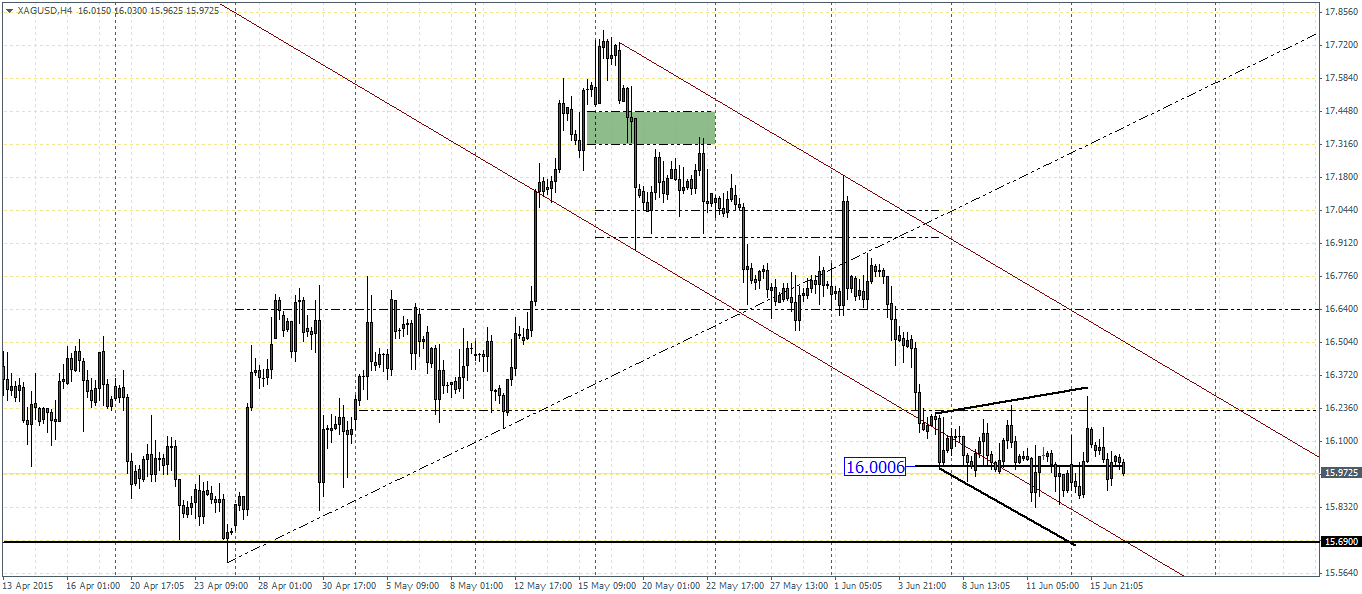
The decline in Silver futures since last week has been more subdued with a small body being printed on last week’s close, just below the break out of the bearish pennant pattern. However, considering that prices are close to the major support near 15.58 through 14.59, we could expect some sideways consolidation to take place before we get further clues to the trend.
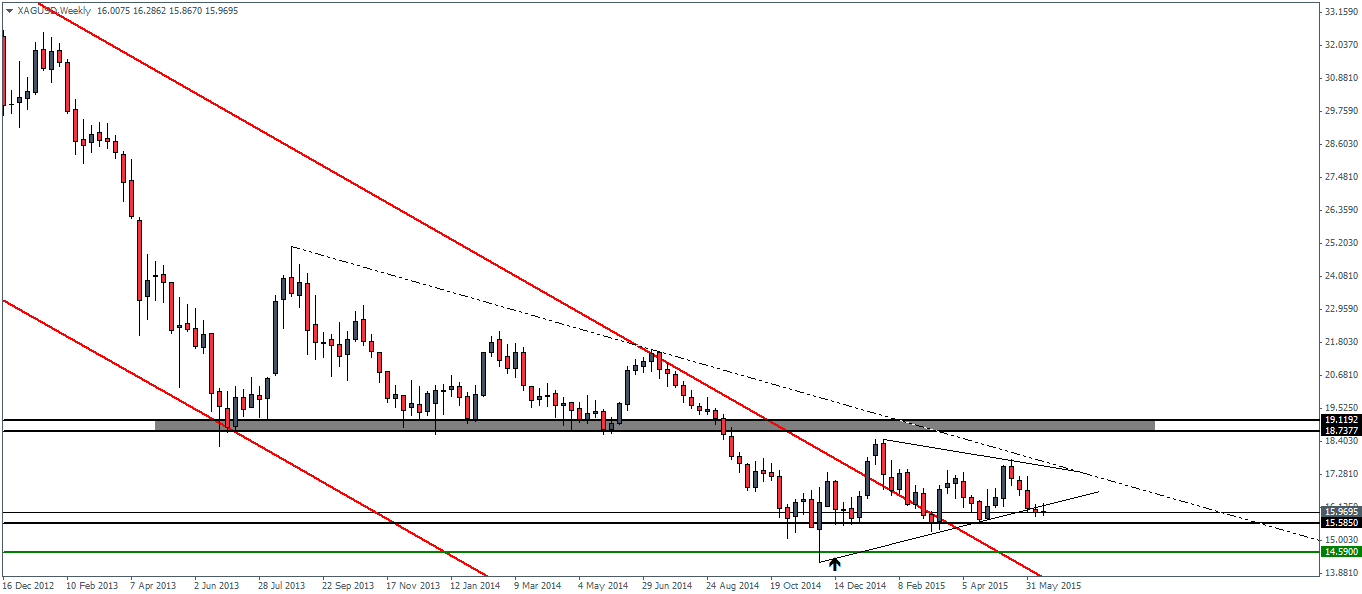
On the H4 chart, price is still trading within the broadening wedge pattern of the falling price channel, albeit currently near the support/resistance level of 16. A decline lower and a possible retest of 16 as resistance could see a dip towards 15.69 level of support. A close above the highs near 16.23 would invalidate this downside bias and could offer early clues into a possible rally on a break out from the falling price channel.
Today’s major risk to the precious metals comes from the US Federal Reserve’s monetary policy statement. The markets are looking for any clues on a clear indication of a rate hike and the tone of the statement could probably offer some insights. The markets are expecting a rate hike in September/October but that is subject to change should the Fed strike a dovish tone. The chances of a dovish outlook today does not rank high as various economic indicators have managed to break free from the first quarter slump. A hawkish view from the Fed could potentially attract fresh buyers into the market as far as interest rates are concerned.

![Credit Card 160×600 [EN]](https://assets.iorbex.com/blog/wp-content/uploads/2023/06/13144507/Blog-Banner_EN-Banner_160X600X2.webp)