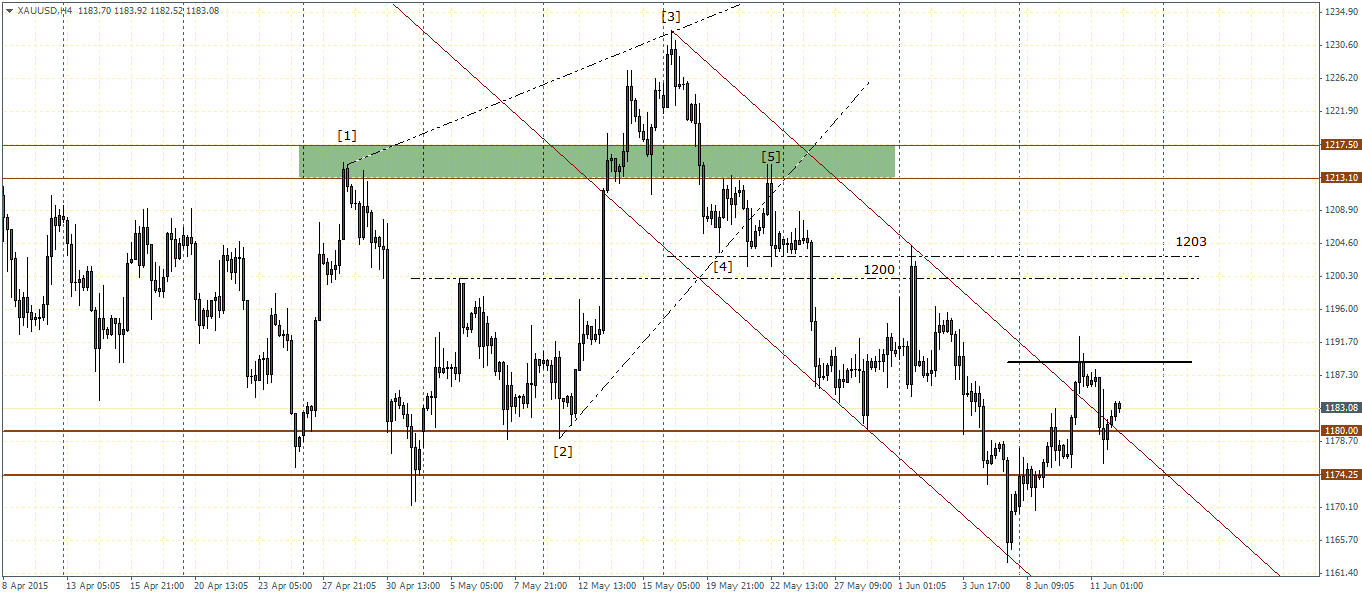
After posting declines for three straight weeks, Gold futures on the weekly chart is currently looking to form an inside bar, within the support zone of 1202 through 1171. Currently, Gold futures have gained over 1% for the week. This inside bar formation comes just after the break of the bearish flag pattern and we expect this rally to at the very least retest as high as 1200. As a precaution, a weekly close above the 1200 region will offer us early clues into a possible spike to the upside.
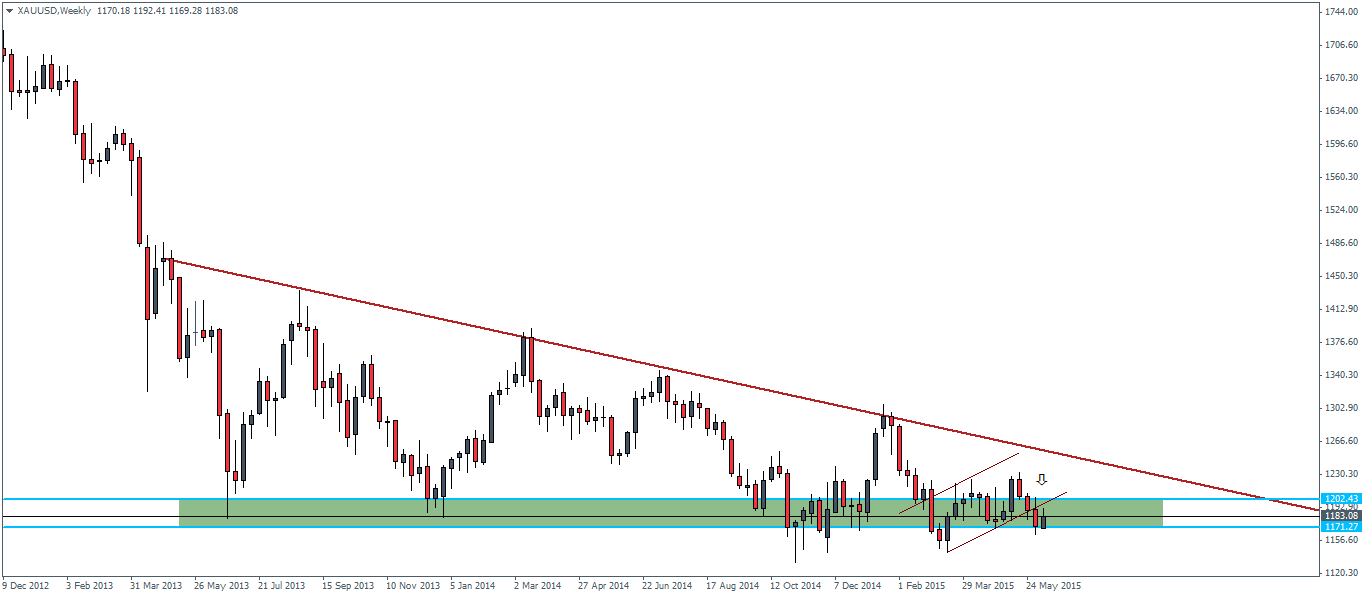
Looking to the short term intraday charts, we find that prices of Gold saw quite a bit of consolidation near the lower support level of 1180 – 1174.25, at one point briefly dipping below this level to post a new low to 1165.7. However, prices managed to rally back above the support zone as well as currently pointing to a possible break out from the falling price channel. If prices manage to break higher above 1189, the most recent swing high, Gold futures could potentially retest the 1200 – 1203 level of support and resistance. This view from the intraday charts shows confluence with the weekly charts that we pointed to earlier.

Silver futures have also seen close to three weeks of decline with the latest weekly candlestick showing a possible break out to the downside after prices began to consolidate within the triangle pattern since October last year. So far, Silver futures are down -0.54% for the week.
The downside breakout will however struggle to break below the 15.58 through 14.59 level of support. We can therefore expect to see further consolidation take place near this price zone.
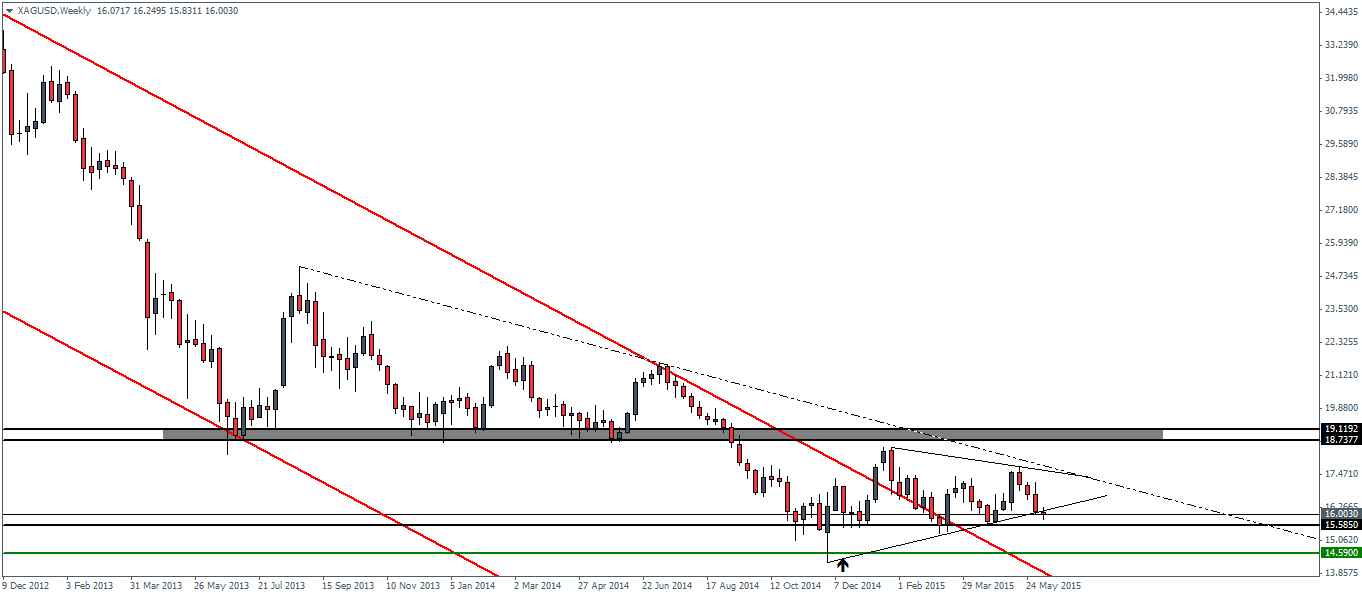
Switching to the intraday charts, Silver prices have been gradually trending lower within the falling price channel. Currently, price looks to be forming a broadening wedge pattern and this gives us the price level of 16, which could be critical going forward.
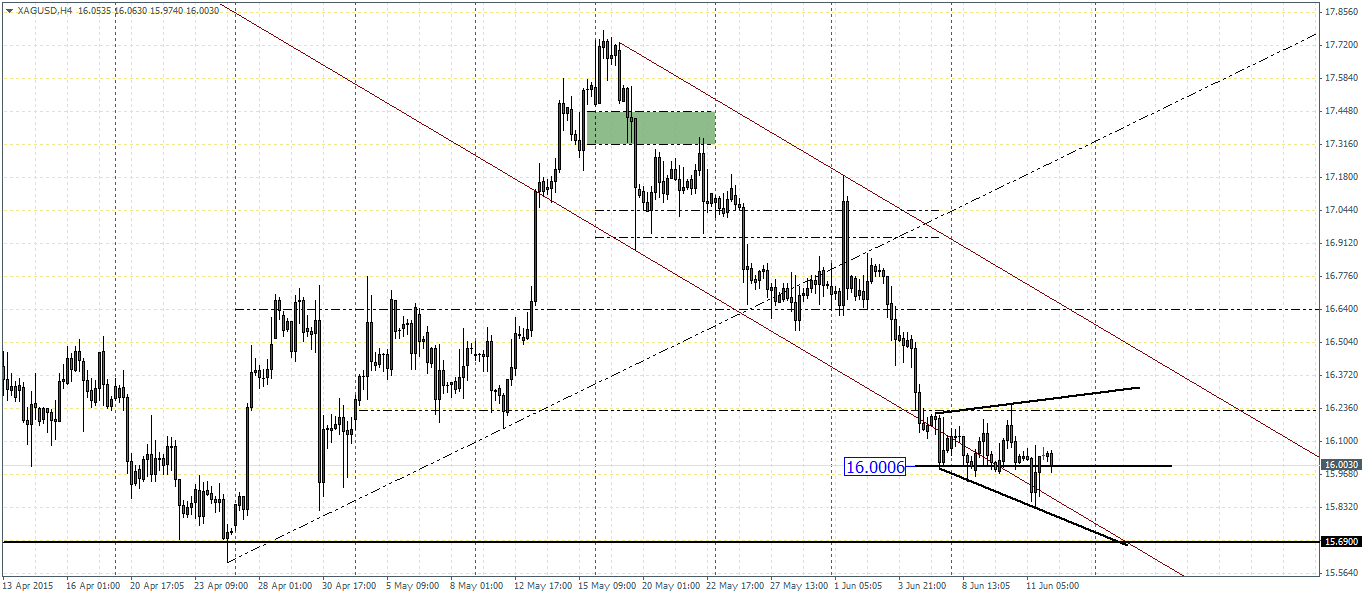
If price finds support near the price zone of $16, we could possible expect an upside breakout that could likely see a rally to test the previous broken support of 16.23 being tested for resistance. On the other hand, if $16 turns to resistance, we could expect further declines in Silver futures with the prices likely to target the previous lows at 15.69

