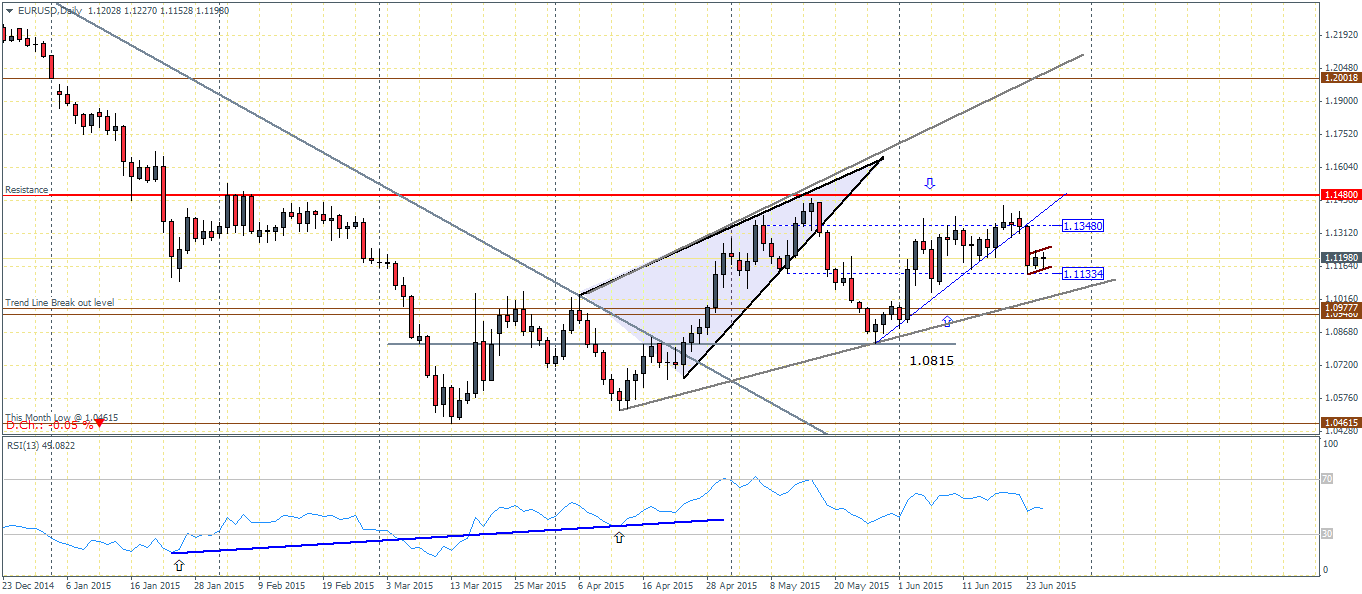
EURUSD (1.119): Following up from Monday’s analysis, the break of the minor trend line saw prices decline towards 1.1133 as noted. However, the decline to 1.1133 was only by price low and hence we could expect to see a more firm test near 1.1133 on the closing prices. The current sideways consolidation is likely to see a breakdown lower which could result in a decline to the support level between 1.0977 through 1.0948.
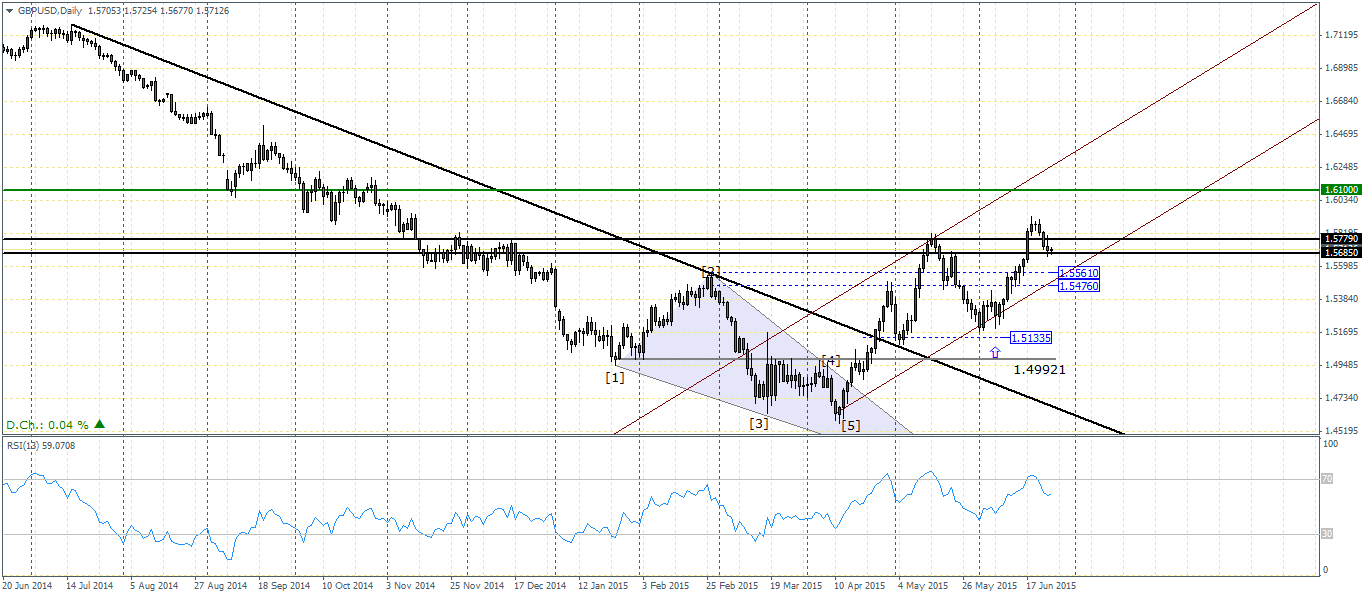
GBPUSD (1.5713): As noted in the analysis earlier this week, GBPUSD has reversed its gains forming a strong reversal pattern at the top. Price action has declined now back into the support zone between 1.5779 through 1.5685. If prices hold here, we could expect another bounce to the upside. Alternatively, a break below 1.5685 could see a test to 1.5561 through 1.5476.

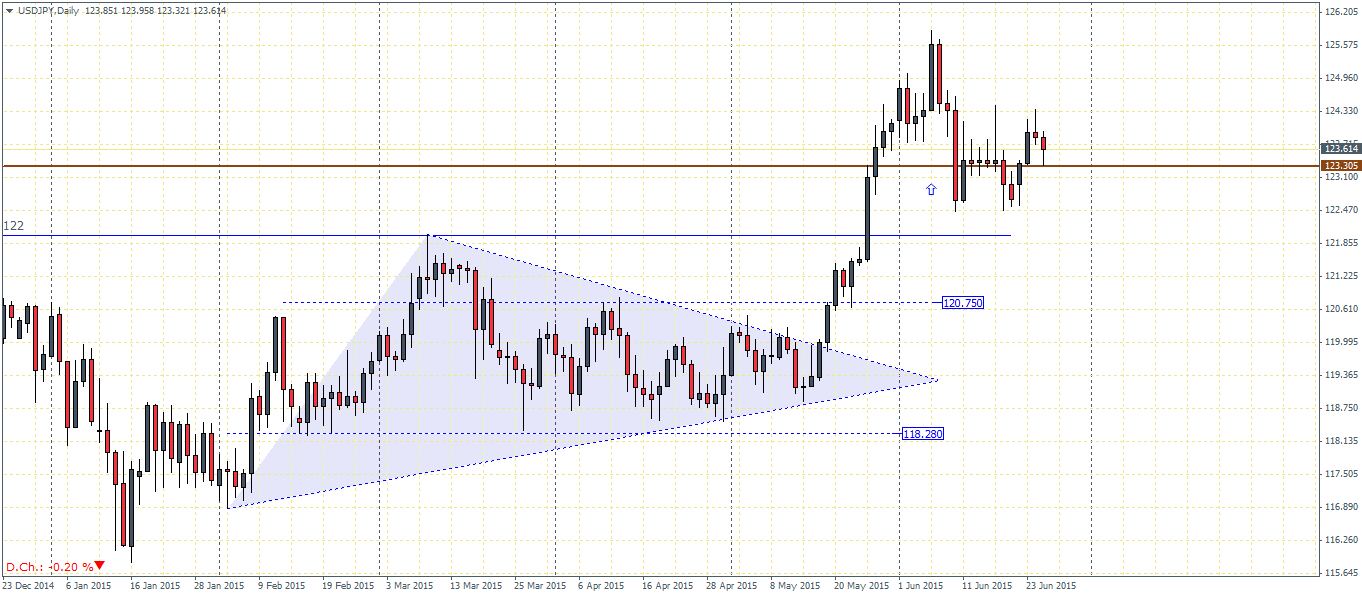
USDJPY (123.59): USDJPY has been consolidation above 123.3 level without any major moves. Yesterday’s candlestick has formed a shooting star and if today’s close is bearish we could expect a break below 123.3 which will see a test to 122 support. On the other hand, if prices hold above 123.3, the double bottom pattern could see prices rally towards previous highs near 125.575.
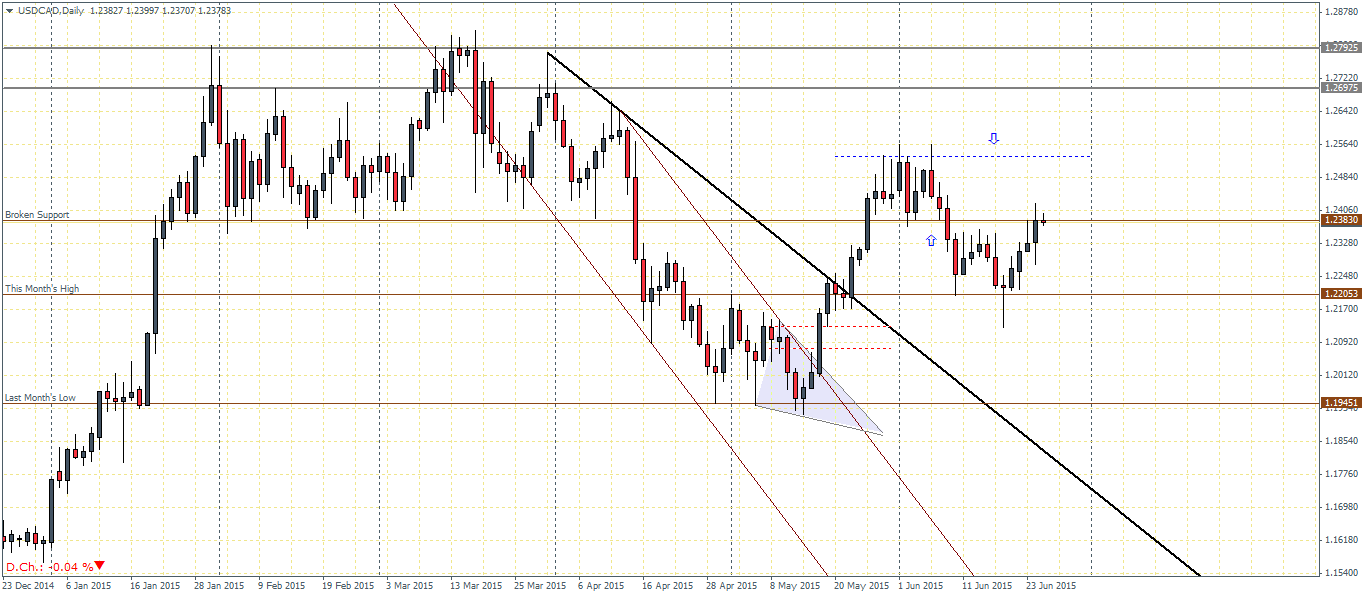
USDCAD (1.2378): USDCAD has managed to rally towards 1.2383 after establishing support at 1.22. A break above 1.2383 is needed for USDCAD to test 1.2533. In the event 1.2383 turns to resistance and prices fail to close above, USDCAD could decline back to 1.22 and possibly lower.
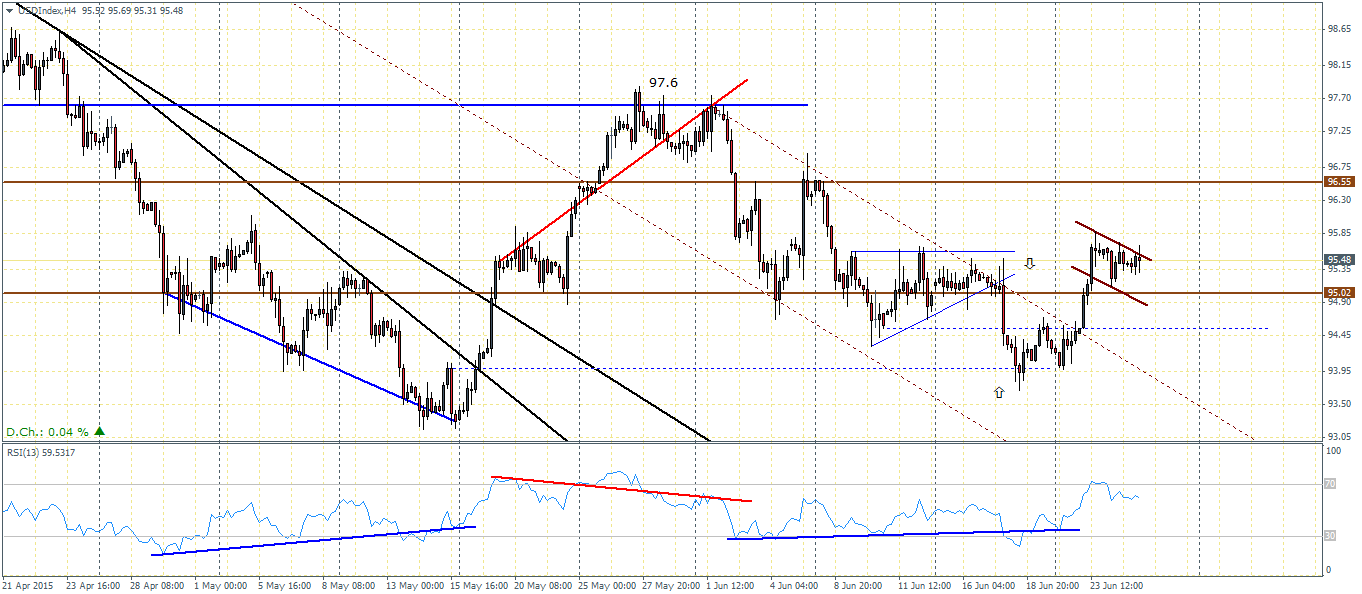
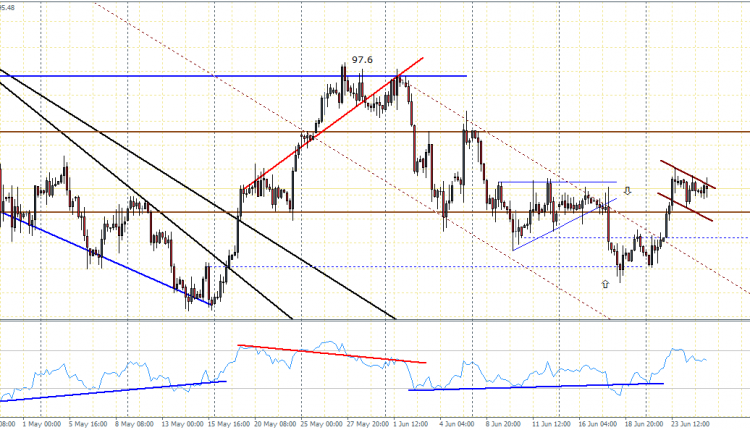
US Dollar Index (95.47): The Dollar index touched down towards the break out level from the previous falling wedge pattern and quickly managed to rally above 95 support/resistance level. Currently we notice price making a bull flag pattern which gives an upside target to 96.55 and beyond. To the downside, 95 could act as support to hold any declines. A close below 95 could however turn the US Dollar Index very bearish.